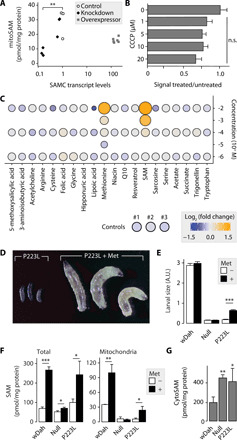
Fig. 3. Cytosolic SAM production and not SAMC regulates the mitoSAM pool.

(A) mitoSAM levels upon RNAi knockdown or overexpression of cg4743 with corresponding transcript levels (two knockdown lines, one da-GAL4/+ control line, and two overexpression lines; n = 3). (B) Relative SAM import rates into enriched larval mitochondria upon uncoupling with carbonyl cyanide m-chlorophenyl hydrazone (CCCP) (n = 4). Control is 0 μM CCCP and was treated with dimethyl sulfoxide only. (C) Metabolic rescue of p223l larvae grown on standard yeast food supplemented with metabolites at the given concentration (n ≥ 10). Color indicates log2-transformed fold change of larval size relative to controls, and circle size relates to observed larval size. Controls are larval size means of three independent vials. (D) Six-day-old p223l larvae grown on standard food with or without methionine supplementation. (E) Size quantification of larvae with or without methionine supplementation (n ≥ 10). A.U., arbitrary units. (F) Steady-state levels of SAM in total larval extracts and a mitochondrially enriched fraction with or without methionine supplementation (n = 3). (G) Cytosolic SAM levels (n = 4) in untreated larvae. Bar graphs show means + SD. n.s., not significant. *P < 0.05, **P < 0.01, and ***P < 0.001 with two-sided Student’s t test against wDah controls (E and F) or Dunnett’s test against control (A and B) or wDah (G). (A) to (C) and (E) to (G) performed on 4-day-old larvae. Met, 10 mM methionine.
