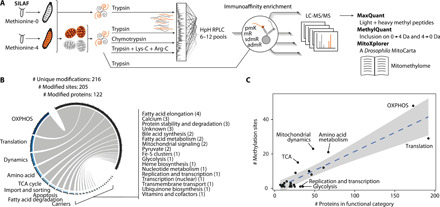
Fig. 4. A methyl-SILAF map of mitochondrial protein methylation.

(A) Schematic overview of the workflow to detect the mitochondrial protein methylome. Mitochondrial or total protein extracts of 1:1 mixed unlabeled:labeled larvae were subjected to various protease digestions; in part high-pH reversed-phase liquid chromatography (HpH RPLC); antibody-based peptide enrichments against various l-lysine modifications (pmK) or monomethyl, symmetric, or asymmetric dimethyl l-arginine (mR, sdmR, and admR); liquid chromatography coupled to mass spectrometry; and bioinformatic data processing. (B) Number of modifications, sites, proteins, and their mitochondrial functional categories within the untargeted protein methylation library. (C) Relation of number of methylation events by number of protein members of the respective functional category. Blue dashed line shows the linear regression (R2 = 0.72) with a 99% confidence interval in gray. Functional categories with an absolute standardized residual of more than one are labeled.
