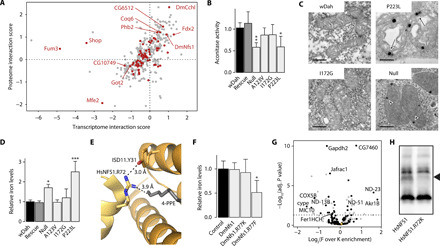
Fig. 6. ISC assembly is sensitive to mitoSAM loss.

(A) Interaction score of p223l transcriptomics and proteomics. Methylated proteins are shown in dark red. Gene names to methylated targets with an absolute interaction score of >1 in at least one dataset. (B) Mitochondrial aconitase activity (n = 4). (C) Transmission electron micrographs. Arrows indicate suspected iron deposits in null and p223l mitochondria. Scale bar, 0.5 μm. (D) Total cellular iron levels in 4-day-old Dm larvae (n = 4). (E) Interaction site of R72 in HsNFS1 with ISD11 and 4-PPE in gray [Protein Data Bank (PDB): 5USR]. (F) Cellular iron levels in fly models overexpressing DmNfs1 constructs (n = 3). Control is da-GAL4/+. (G) Immunoenrichment of DmNfs1.R77F-FLAG over DmNfs1.R77K-FLAG (n = 4). Black dots, mitochondrial; orange dot, DmNfs1. Significant proteins with known relation to iron metabolism or OXPHOS are labeled. (H) BN-PAGE immunoblot with an antibody against NFS1 in cells overexpressing HsNFS1-FLAG constructs (representative image, n = 3). The missing band in HsNFS1.R72K is marked. Graphs show means + SD. *P < 0.05, **P < 0.01, and ***P < 0.001 with Dunnett’s test against wDah (B and C) or control (F) or false discovery adjusted P value (G). (A) to (D), (F), and (G) performed on 4-day-old larvae.
