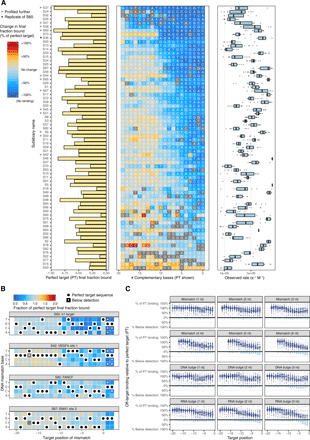
Fig. 2. Diversity of dCas9 off-target association across sgRNA.

(A) Association data for sgRNA from zero (PAM-proximal) to perfect (PAM-distal) complementarity. The perfect target final fraction bound is shown for each sgRNA on the left; off-target binding relative to perfect target is shown in the middle; the distribution of observed on-rates for the 20 targets in the center column is shown on the right. (B) Single mismatch data for four sgRNAs. PAM mutations are often near or below the limit of detection (asterisks), but many seed mismatches (positions −8 to −1) are within dynamic range. (C) Summary of association data collected across measured sgRNAs. Each panel visualizes mismatch or bulge series (of varying size) positioned alongside each base pair of the target sequence. Above the line, binding is reported as a percentage of perfect target binding level. Below the line, bars summarize the percent of sgRNA for which the off-target binding was below detection. For example, the majority of sgRNAs exhibit undetected binding for 3-bp RNA bulges in the seed (bottom right facet).
