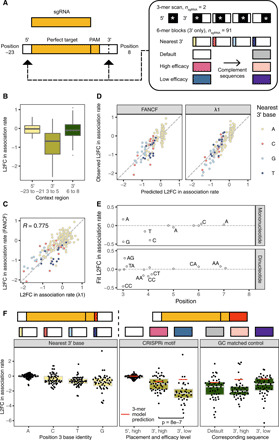
Fig. 4. Impact of 5′ and 3′ sequence variation on perfect target binding and cleavage.

(A) The 5′ and 3′ sequence variation was tested for all 3-mer blocks located beside two perfect targets as well as alternate base immediately downstream of the NGG PAM and specific 6-mer blocks 3′ for 91 perfect targets. (B) Impact of sequence variation 5′ of target sequence (positions −23 to −21) and 3′ of target sequence (positions 3 to 8), split by region. (C) Comparison of 5′ and 3′ sequence variation effects from 3-mer scan for FANCF and λ1 sgRNAs. (D) Results of learning a LASSO dinucleotide model for predicting the effect of 5′ and 3′ dinucleotides on association rate. (E) Visualization of the selected coefficients from the LASSO dinucleotide model, with high-weight features labeled. (F) Effect of 3′ sequence variation on association rates across 91 RNPs. In the left facet, the nucleotide flanking the NGG PAM downstream is shown to affect on-rate. In the center facet, extended motifs taken from a study of CRISPRi efficacy are shown. In the right facet, GC-matched 3′ sequence variants demonstrate that motifs are not driven solely by GC content.
