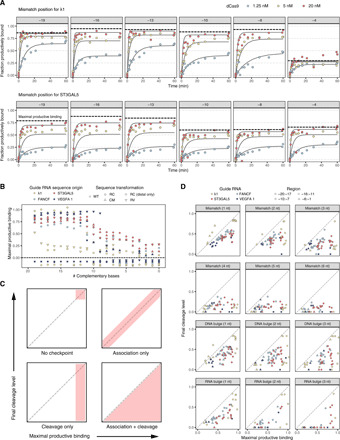
Fig. 5. Joint fits for dCas9 association across three concentrations.

(A) Joint fits for two sgRNAs and corresponding singly mismatched targets. The dashed line signifies the fit maximal productive binding. (B) Maximal productive binding is shown as a function of the number of complementary bases for all 12 jointly fit libraries. Most libraries show a transition around 10 bp of complementarity. Targets below the dashed line are below the limit of detection. WT, wild type; RC, reverse complement sequence; CM, complement sequence; RV, reverse sequence. (C) Expected joint distributions of maximal productive binding (x axis) and final cleavage level (y axis) under four different gating possibilities at Cas9 association and/or cleavage. (D) Observed joint distributions for maximal productive binding (x axis) and cleavage (y axis) for jointly fit libraries. With increasing perturbation of sgRNA:target matching, targets fall farther below the diagonal.
