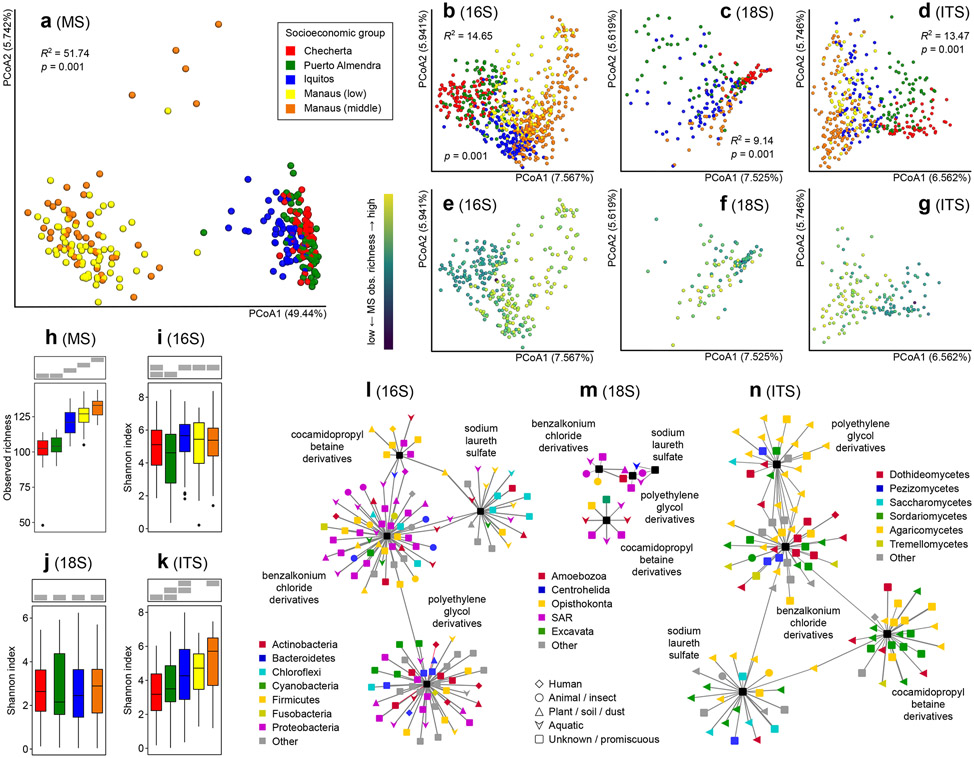
Figure 2. House chemical and microbial diversity is altered by urbanization.
a. Principal coordinate analysis (PCoA) of chemical compounds (n=270), showing strong clustering by community, but not by socioeconomic group within one community (Bray-Curtis distance metric; PERMANOVA R2 and p-values are displayed). b-d. PCoA of bacterial (n=681), eukaryotic (n=215) and fungal (n=401) composition showing significant segregation among locations in the urbanization gradient (Jaccard distance metric; PERMANOVA R2 and p-values are displayed within each panel). e-g. Correlation between chemical richness and diversity of bacteria (e), eukaryotes (f) and fungi (g). h-k. Diversity of chemicals (h, observed richness, n=270) and microbes (i-k, Shannon diversity) (i, n=681, j, n=215, k, n=401) across the urbanization gradient. Boxplots display median and interquartile range, with boxplot whiskers extending to the most extreme data point within 1.5 times the interquartile range of the first (lower whisker) or third (upper whisker) quartile. Grey boxes on top of each panel indicate sample groupings (one group per row) by the M-W test. Samples sharing a grey bar at the same position are not significantly different (two-sided M-W p>0.05). Chemical and fungal diversity increased with urbanization. No significant differences were observed in 16S or 18S alpha diversity across the urbanization gradient. Chemical diversity analyses were based on all detected small molecule features in our dataset. l-n. Correlation analysis of cleaning and personal care product abundance and house bacteria (l, n=256), microeukaryotes (m, n=82) or fungi (n, n=140). Only correlations with an FDR-corrected Pearson correlation p-value greater than 0.05 are displayed. Outer nodes represent microorganisms (colored by phylum for bacteria, clade for eukaryotes and class for fungi; shaped by source) and central rectangles represent cleaning/personal care products. Names indicate the cleaning/personal care product at the center of each correlation cluster. Edge length is proportional to Pearson correlation p-value (FDR-corrected); edge thickness is proportional to Pearson correlation coefficient (independent scale for each panel). Negative correlations are indicated by red edges.

