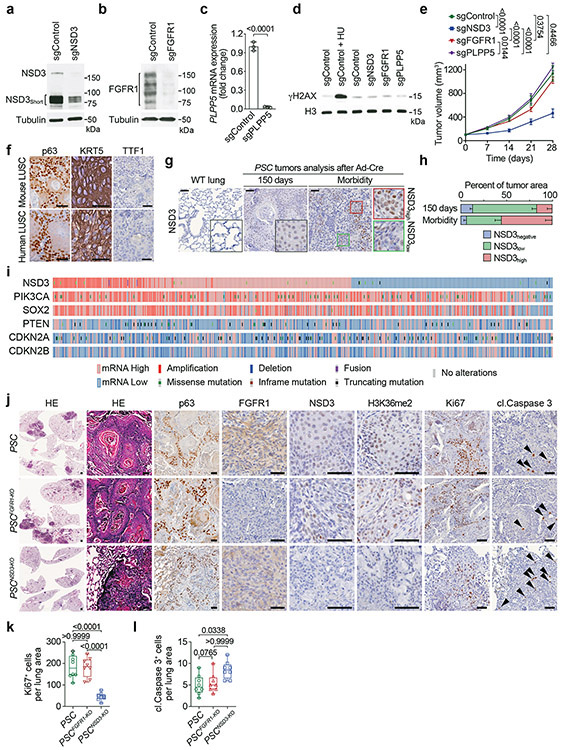
Extended Figure 2. NSD3 but not FGFR1 depletion inhibits LUSC tumorigenesis in vivo.
a, Western blot analysis with the indicated antibodies of whole-cell lysates from H520 cells expressing sgControl or sgNSD3. The bands representing NSD3 and NSD3Short are indicated. Tubulin was used as a loading control. b, Western blot analysis with the indicated antibodies of whole-cell lysates from H520 cells expressing sgControl or sgFGFR1. Tubulin was used as a loading control. c, Real-time (RT) qPCR analysis of PLPP5 mRNA expression in H520 cells expressing sgControl or sgPLPP5. We note that several commercial antibodies against PLPP5 were tested but we could not detect any reproducible band close to the correct size (data not shown). The RT-qPCR data were normalized to Actb and presented as fold change relative to the sgControl sample. Error bars represent mean ± s.d. from three independent experiments. P value determined by two-tailed unpaired t-test. d, Treatment of the 8p11AMP-positive H520 LUSC cell line with sgRNAs targeting the 8p11-amplified region does not cause an increase in phosphorylated H2AX (γH2AX). Western blot analysis with the indicated antibodies of H520 cells expressing Cas9 and the indicated sgRNAs. DNA damage-induced by hydroxyurea (HU) treatment was used as a positive control, H3 was used as a loading control. e, Depletion of NSD3, but not depletion of FGFR1 or PLPP5, attenuates xenograft growth of the 8p11AMP H520 LUSC cells. Tumor volume quantification of the indicated H520 xenografts generated in immunocompromised mice (n = 5 mice, for each treatment group). P values indicated determined by two-way ANOVA with Tukey’s post hoc test. Data are represented as mean ± s.e.m. Data showing sgControl, sgNSD3 and sgFGFR1 are the same as from Figure 1b. f, Representative HE-stained sections and IHC staining of lung tissue from PSC mouse model lung tumor showing key diagnostic histological features of LUSC including positive staining for keratin and p63 and negative staining for TTF1 (representative of n = 8 samples for each group). Human LUSC samples are shown for comparison (representative of n = 8 samples for each group). Scale bars, 50 μm. g, Increased expression of NSD3 in lungs tracks with tumor progression. IHC analysis of NSD3 levels in wild type lung and tumor biopsies collected from the PSC model at 150 days and at the clinical endpoint when animals develop significant morbidity (representative of n = 8 samples for each group). Scale bars, 50 μm. h, Quantification of NSD3 levels in tumor biopsies as in (g) within tumor areas that have high-, low-intensity or negative staining for chromogen. Data are represented as mean ± s.e.m. i, NSD3 mRNA overexpression is common (~60%) and not limited to 8p11-12 amplified tumors. Genetic alterations and mRNA expression of the indicated genes in human LUSC patient samples from the TCGA dataset showing frequency of overexpression and alternations in NSD3 and known driver mutations PIK3CA, PTEN, SOX2, CDKN2A, CDKN2B. j, Representative HE-stained sections and IHC staining of lung tissue from PSC (control), PSCFGFR1-KO and PSCNSD3-KO mutant mice, (representative of n = 8 mice for each experimental group). Scale bars, 50 μm; arrowheads, positive cleaved Caspase 3 cells. k, l, Quantification of Ki67 (Ki67+ positive cells) a marker of proliferation (k) and cleaved Caspase 3 (cl. Caspase 3+ positive cells) a marker of apoptosis (l) in samples as in (j). In k, l and in all subsequent box plots, the line indicates the median, the box marks the 75th and 25th percentiles and the whiskers indicate the minimum and maximum values. All data points are shown. P values indicated determined by one-way ANOVA with Tukey’s post hoc test (k, l).

