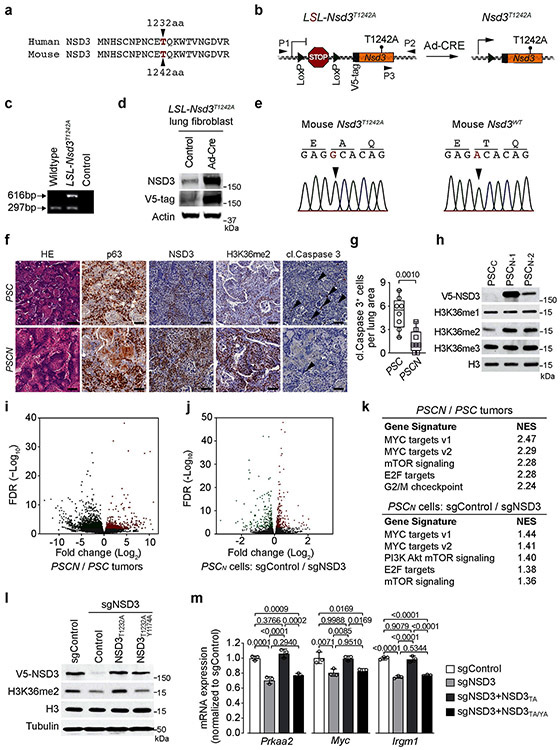
Extended Figure 5. Generation of PSCN LUSC mouse model and NSD3 coordination of an oncogenic gene expression program in LUSC.
a, Alignment of NSD3 human and mouse residues spanning human T1232 indicates that human NSD3 T1232 corresponds with murine NSD3 T1242. b, Schematic of the LSL-V5-Nsd3T1242A conditional allele. In the presence of Cre recombinase, a translational stop cassette flanked by LoxP recombination sites is deleted to enable V5-Nsd3T1242A expression. P1 and P2 indicate location of genotyping primers. c, Confirmation of successful generation of LSL-Nsd3T1242A allele by PCR (P1+P2+P3 primers) on DNA isolated from mouse tail biopsies from indicated mouse genotypes, expected products sizes are marked (upper panel). d, Western blots with the indicated antibodies (V5 antibody detects V5-tagged NSD3T1242A) of lysates from LSL-V5-Nsd3T1242A lung fibroblast transduced ex vivo with Ad-Cre or vehicle (control). Actin is shown as a loading control. e, Left panel: Sanger sequencing confirmation Nsd3T1242A mutation is present in generated conditional LSL-V5-Nsd3T1242A mutant mouse. Wild-type NSD3 sequence from control animals is shown on the right panel. f, Representative HE-stained and IHC staining with indicated antibodies of lung tissue sections from PSC and PSCN mutant mice, (representative of n = 8 mice for each group). Scale bars, 50 μm; arrowheads, positive cleaved Caspase 3 cells. g, Quantification of cleaved Caspase 3 (cl. Caspase 3+ positive cells) a marker of apoptosis in samples as in (f). P values indicated determined by two-tailed unpaired t-test. h, Western blots with indicated antibodies of whole-cell lysates from PSCC or two different PSCN cell line. Total H3 was used as a loading control. i, Volcano plot of RNA-seq comparison between PSCN and PSC tumor biopsies (three independent biological replicates for each condition) results in higher expression of 891 genes shown in red (fold change log2 ≤ −0.5 and P < 0.05 by Wald test) and decreasing expression of 1839 genes shown in green (fold change log2 ≥ 0.5 and P < 0.05 by Wald test). False discovery rate (FDR) values are provided. j, Volcano plot of RNA-seq comparison of PSCN cells ± sgNSD3 (three biological replicates for each condition) causes decreasing expression of 234 genes shown in red (adjusted P < 0.001 by likelihood ratio test) and increasing expression of 229 genes shown in green (adjusted P < 0.001 by likelihood ratio test). False discovery rate (FDR) values are provided. k, Top hallmark gene sets identified in the GSEA analysis of datasets from (i-j) shows high overlap. Normalized enrichment scores (NES) provided (detailed statistics description in Methods). l, Reconstitution of NSD3-deficient PSCN cells with NSD3 and derivatives. Western blot analysis with the indicated antibodies of PSCN whole cell lysates ± sgNSD3 and complemented with the indicated CRISPR-resistant NSD3 derivatives. H3 and tubulin were used as loading controls. m, Quantitative real-time (RT)-PCR analysis of the transcript levels of the indicated genes in the cells as described in (l). The RT-qPCR data for each gene were normalized to Actb and presented as fold change relative to the sgControl sample. Error bars represent mean ± s.d. from three independent experiments. P values indicated determined by one-way ANOVA with Tukey’s post hoc test.

