
Figure 5: The NTE is critical for inhibition.
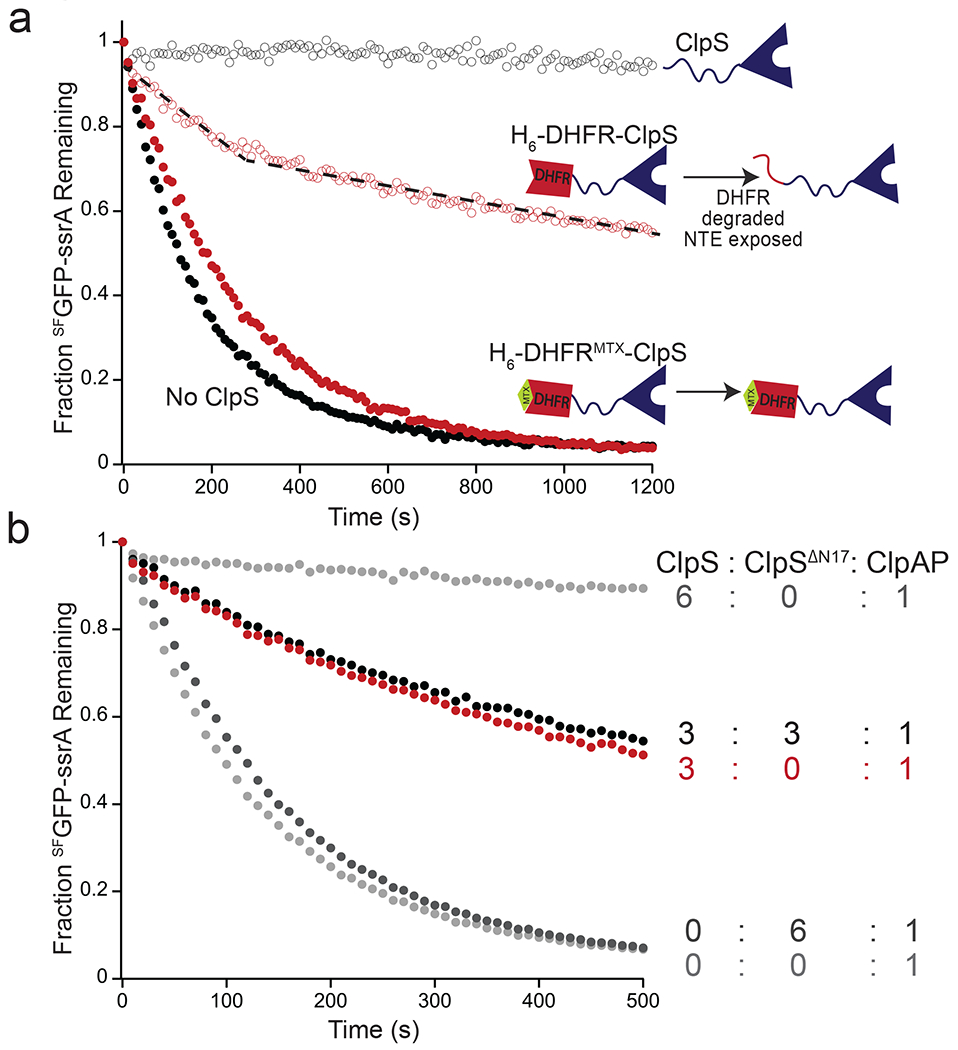
(a) Degradation of SFGFP-ssrA (5 μM) by ClpAP (0.2 μM ClpA6, 0.4 μM ClpP14) alone (solid black circles) or in the presence of 1 μM ClpS (empty black circles), 1 μM H6-DHFR-ClpS (empty red circles), or 1 μM H6-DHFR-ClpS and 10 μM MTX (solid red circles). Data are representative of 3 independent experiments. The dotted line is a visual cue to indicate the biphasic nature of the degradation kinetics in presence of H6-DHFR-ClpS. (b) Inhibition of degradation of SFGFP-ssrA (5 μM) by ClpAP (1 μM ClpA6, 2 μM ClpP14) with ClpS alone (3 μM or 6 μM), ClpSΔN17 alone (6 μM), or a mixture of ClpS (3 μM) and ClpSΔN17 (3 μM). Curves are representative of 3 independent experiments.