
Figure 7: Effect of NTE length on Vmax for degradation.
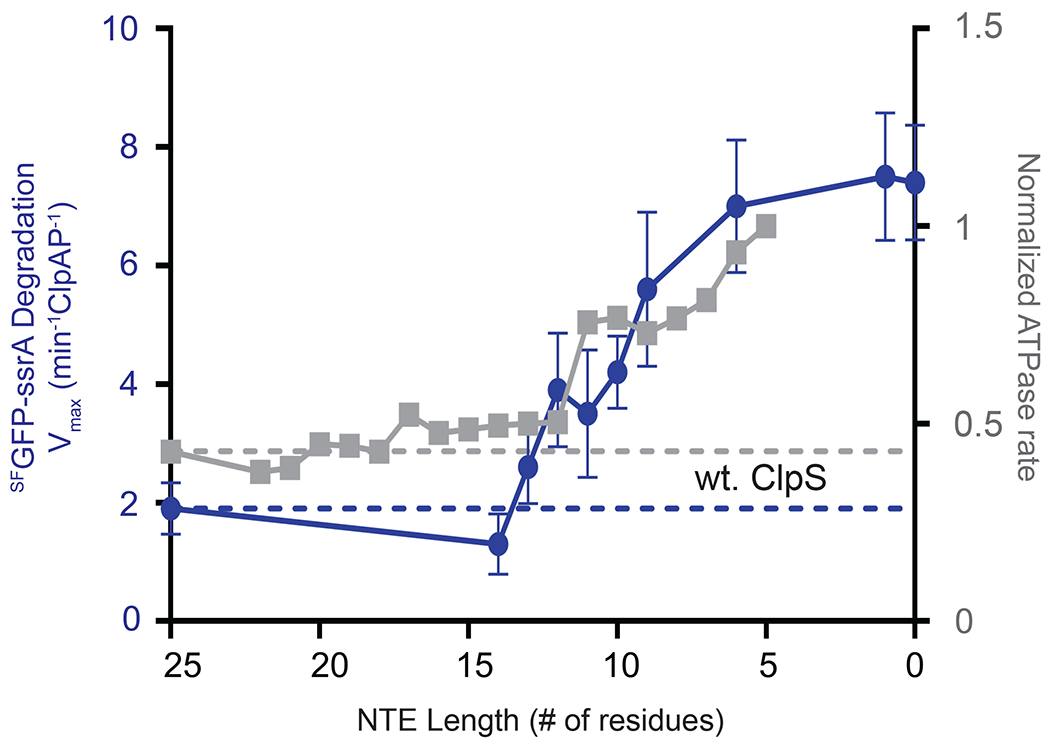
Vmax (blue circles) for ClpAP (0.4 μM ClpA6, 0.8 μM ClpP14) degradation of different concentrations of SFGFP-ssrA were determined by Michaelis-Menten analysis of experiments performed in the presence of NTE truncation variants of ClpS (2.4 μM). Values are average ± 1 SD (n = 3). ATPase rates (grey squares) for ClpAP in presence of ClpS NTE truncation variants from Roman-Hernandez et al [21]. Values were normalized to the wt. ClpA and plotted allowing direct comparison of the changes in Vmax and ATPase rates resulting from varying the ClpS NTE length. The dotted lines represent the values obtained in the presence of wt. ClpS.