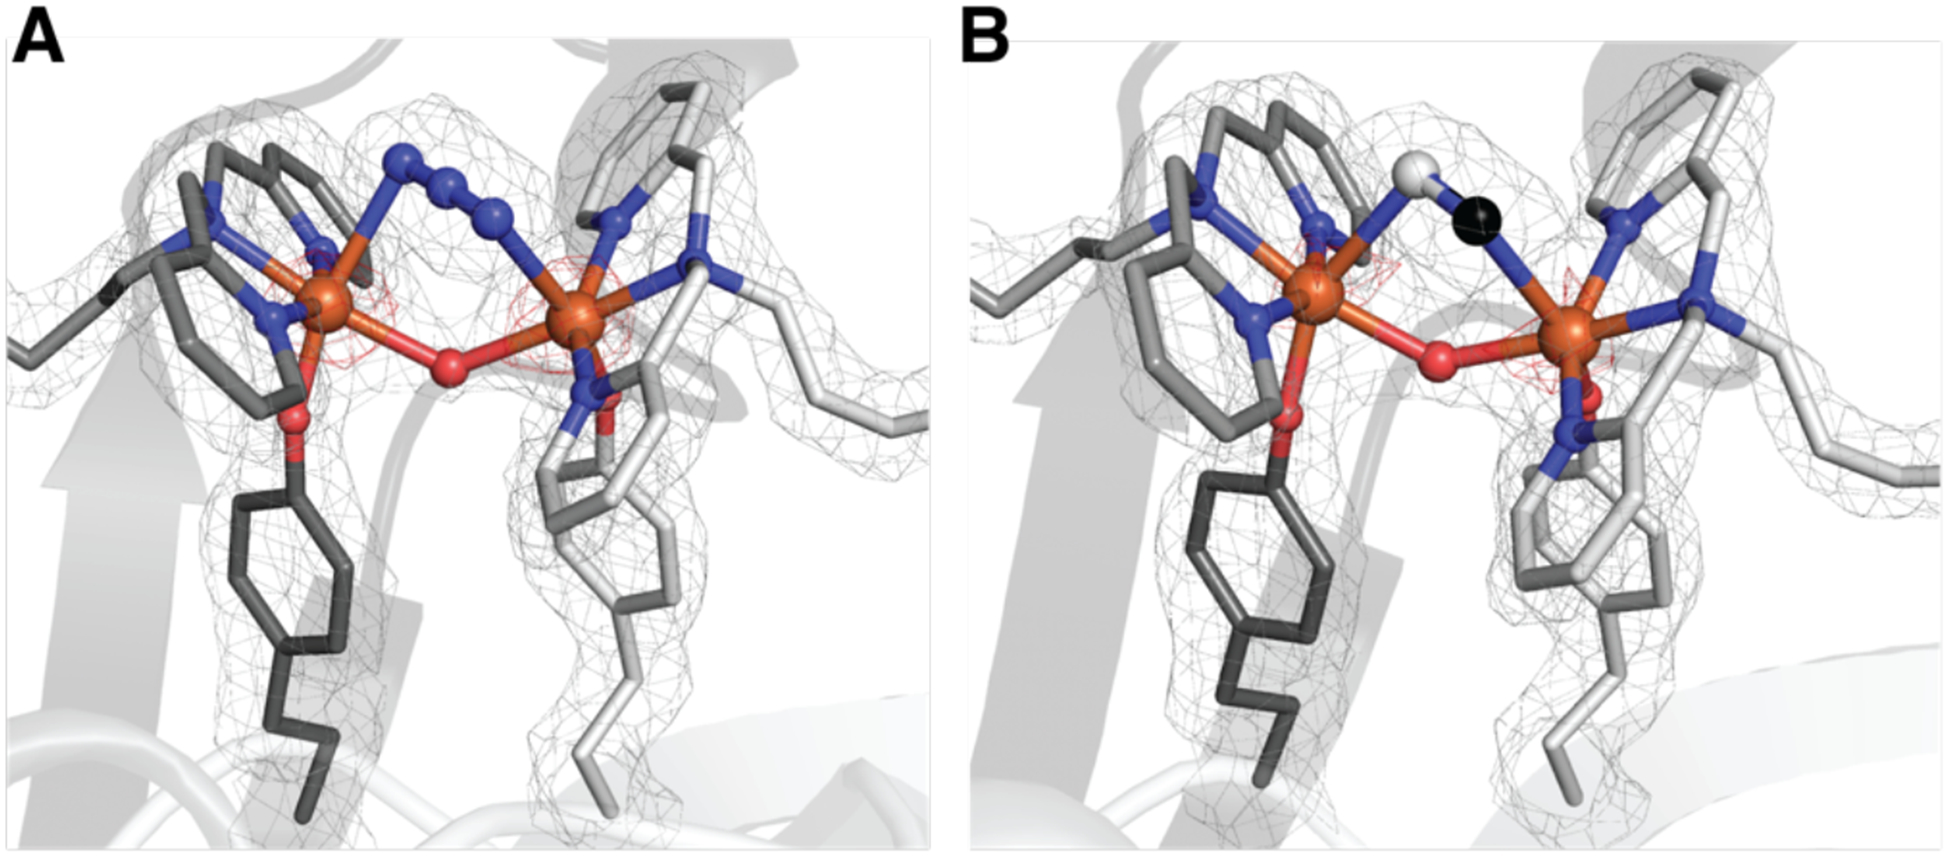
Figure 6.

Structures of the di-Fe complex in 1-N3 (A) and 1-CN (B) (PDB 6VOB and 7KBY). The gray mesh represents the 2F0-FC electron density map (contoured at 1σ) and red mesh is the anomalous difference density (contoured at 4 σ). Atom colors and labels are the same as in Figure 3.
