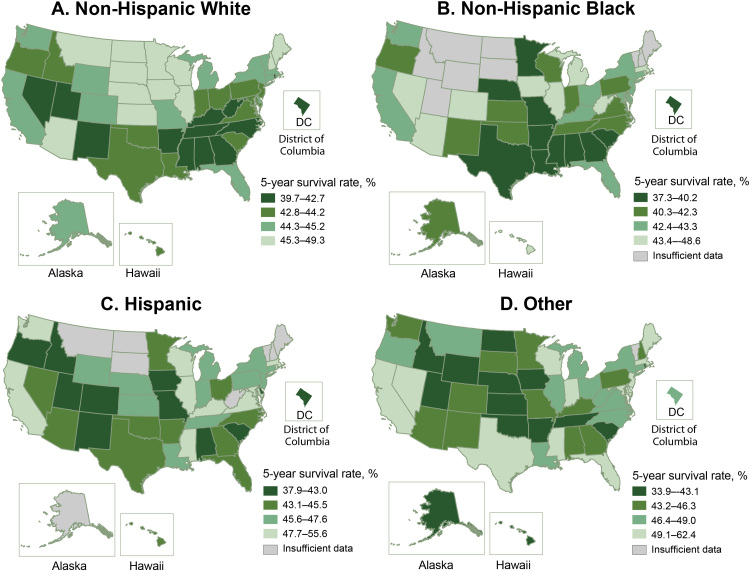
Figure 2.
Adjusted 5-year survival after acute ischemic stroke by race and Hispanic ethnicity among Medicare fee-for-service beneficiaries, Medicare cohort 2008–2017. Map A shows the adjusted 5-year survival after acute ischemic stroke among non-Hispanic White Medicare beneficiaries. Map B shows the adjusted 5-year survival among non-Hispanic Black beneficiaries. Map C shows the adjusted 5-year survival among Hispanic Medicare beneficiaries. Map D shows the adjusted 5-year survival among other (other non-Hispanic races) Medicare beneficiaries. Abbreviation: —, insufficient data.
| State | Adjusted 5-year Survival by Race/Ethnicity |
|||
|---|---|---|---|---|
| Non-Hispanic White | Non-Hispanic Black | Hispanic | Other | |
| Alabama | 40.8 | 38.2 | 39.7 | 43.4 |
| Alaska | 44.3 | 40.9 | — | 42.8 |
| Arizona | 45.6 | 48.6 | 45.0 | 46.3 |
| Arkansas | 40.8 | 37.7 | 44.0 | 40.9 |
| California | 44.3 | 42.8 | 47.9 | 50.7 |
| Colorado | 44.6 | 43.8 | 40.6 | 44.3 |
| Connecticut | 44.7 | 42.6 | 45.6 | 47.1 |
| Delaware | 44.3 | 43.3 | 37.9 | 62.4 |
| District of Columbia | 39.7 | 40.2 | 42.9 | 47.2 |
| Florida | 44.8 | 42.4 | 44.3 | 51.1 |
| Georgia | 42.4 | 40.0 | 44.3 | 45.9 |
| Hawaii | 43.8 | 45.4 | 45.0 | 42.3 |
| Idaho | 43.5 | — | 42.9 | 33.9 |
| Illinois | 45.5 | 43.4 | 48.7 | 47.1 |
| Indiana | 44.2 | 42.3 | 46.2 | 50.1 |
| Iowa | 47.3 | 45.2 | 42.4 | 42.9 |
| Kansas | 45.5 | 41.0 | 46.0 | 43.1 |
| Kentucky | 42.6 | 42.4 | 52.2 | 44.1 |
| Louisiana | 43.0 | 38.8 | 46.6 | 48.6 |
| Maine | 45.9 | — | — | 49.5 |
| Maryland | 44.2 | 42.7 | 52.0 | 51.0 |
| Massachusetts | 45.0 | 47.8 | 49.3 | 52.1 |
| Michigan | 45.1 | 44.1 | 45.9 | 47.9 |
| Minnesota | 47.6 | 37.3 | 45.5 | 44.5 |
| Mississippi | 42.0 | 39.1 | 55.6 | 51.1 |
| Missouri | 44.6 | 40.0 | 38.2 | 44.8 |
| Montana | 46.8 | — | — | 46.5 |
| Nebraska | 46.3 | 38.3 | 46.7 | 40.9 |
| Nevada | 41.9 | 43.3 | 44.5 | 50.9 |
| New Hampshire | 46.7 | — | — | 43.4 |
| New Jersey | 44.1 | 42.5 | 47.6 | 50.2 |
| New Mexico | 41.4 | 40.3 | 42.9 | 45.1 |
| New York | 44.3 | 42.9 | 47.4 | 49.0 |
| North Carolina | 42.3 | 40.2 | 43.5 | 46.5 |
| North Dakota | 49.3 | — | — | 41.4 |
| Ohio | 43.9 | 42.8 | 45.1 | 47.1 |
| Oklahoma | 42.7 | 41.8 | 44.8 | 42.1 |
| Oregon | 44.2 | 41.1 | 41.3 | 47.2 |
| Pennsylvania | 44.1 | 40.4 | 46.6 | 46.3 |
| Rhode Island | 42.4 | 46.3 | 48.3 | 46.1 |
| South Carolina | 43.6 | 39.5 | 43.0 | 42.8 |
| South Dakota | 48.8 | — | — | 45.3 |
| Tennessee | 41.9 | 40.2 | 45.6 | 42.9 |
| Texas | 43.3 | 39.7 | 45.1 | 49.8 |
| Utah | 42.5 | — | 42.0 | 41.8 |
| Vermont | 45.0 | — | — | — |
| Virginia | 43.3 | 40.6 | 48.5 | 46.6 |
| Washington | 44.7 | 43.2 | 50.6 | 44.6 |
| West Virginia | 42.7 | 43.7 | — | 46.7 |
| Wisconsin | 45.9 | 41.5 | 48.9 | 49.5 |
| Wyoming | 45.2 | — | 47.2 | 34.3 |

