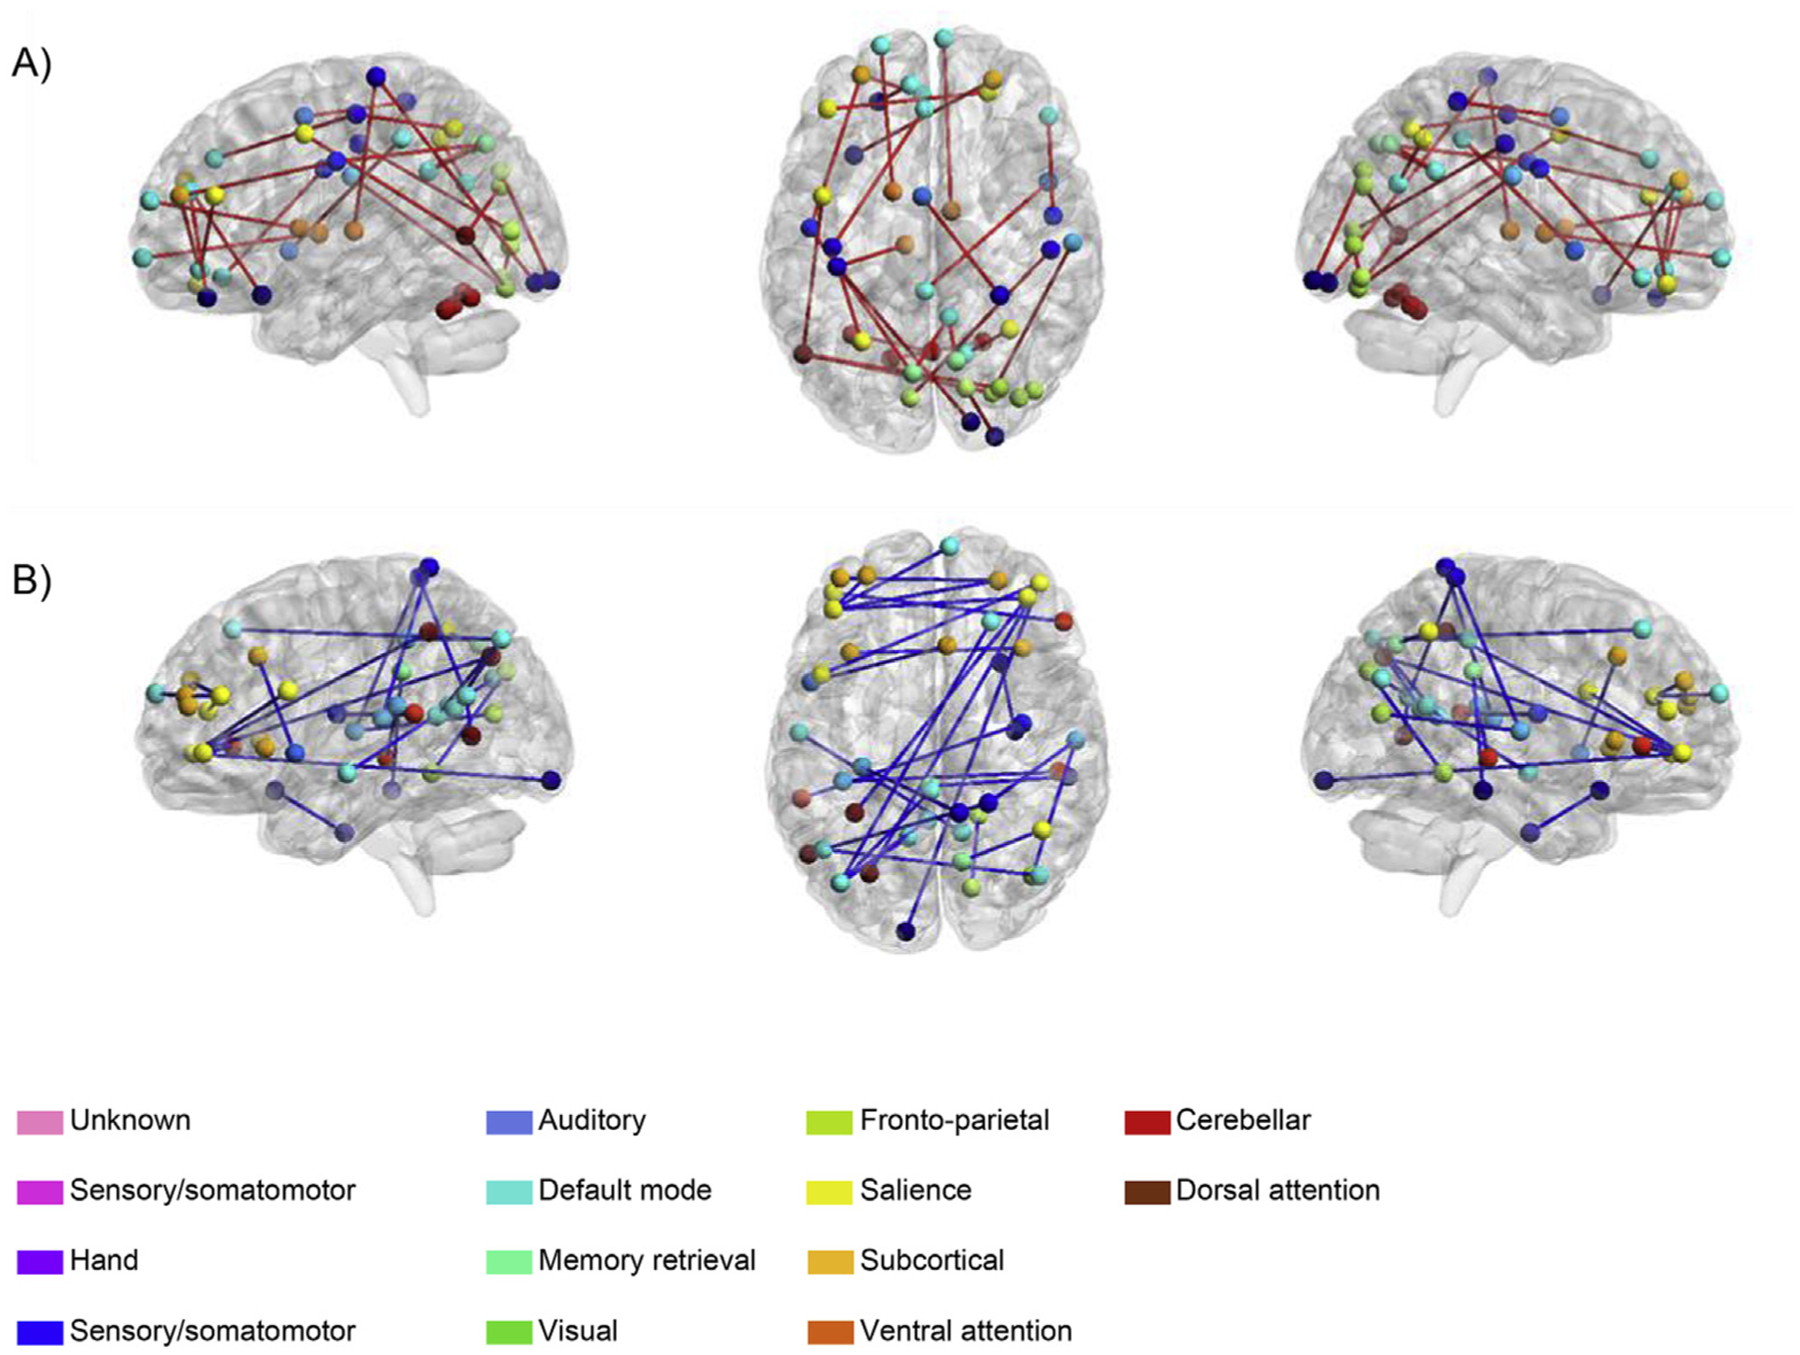
Fig. 4. The IQ-related task-invariant network.

(A) Pairs with positive loadings to the task potency summary score, (B) pairs with negative loadings to the task potency summary score. The task potency summary score was created by performing PCA and using loadings to the first principal component to create subject scores. ROIs with the same color belong to the same system as defined by Power et al. (2011). Edges in blue reflect a negative relationship between IQ and that pair’s task potency, edges in red indicate a positive relationship. This figure was created with the BrainNet Viewer (http://www.nitrc.org/projects/bnv/) (Xia et al., 2013).
