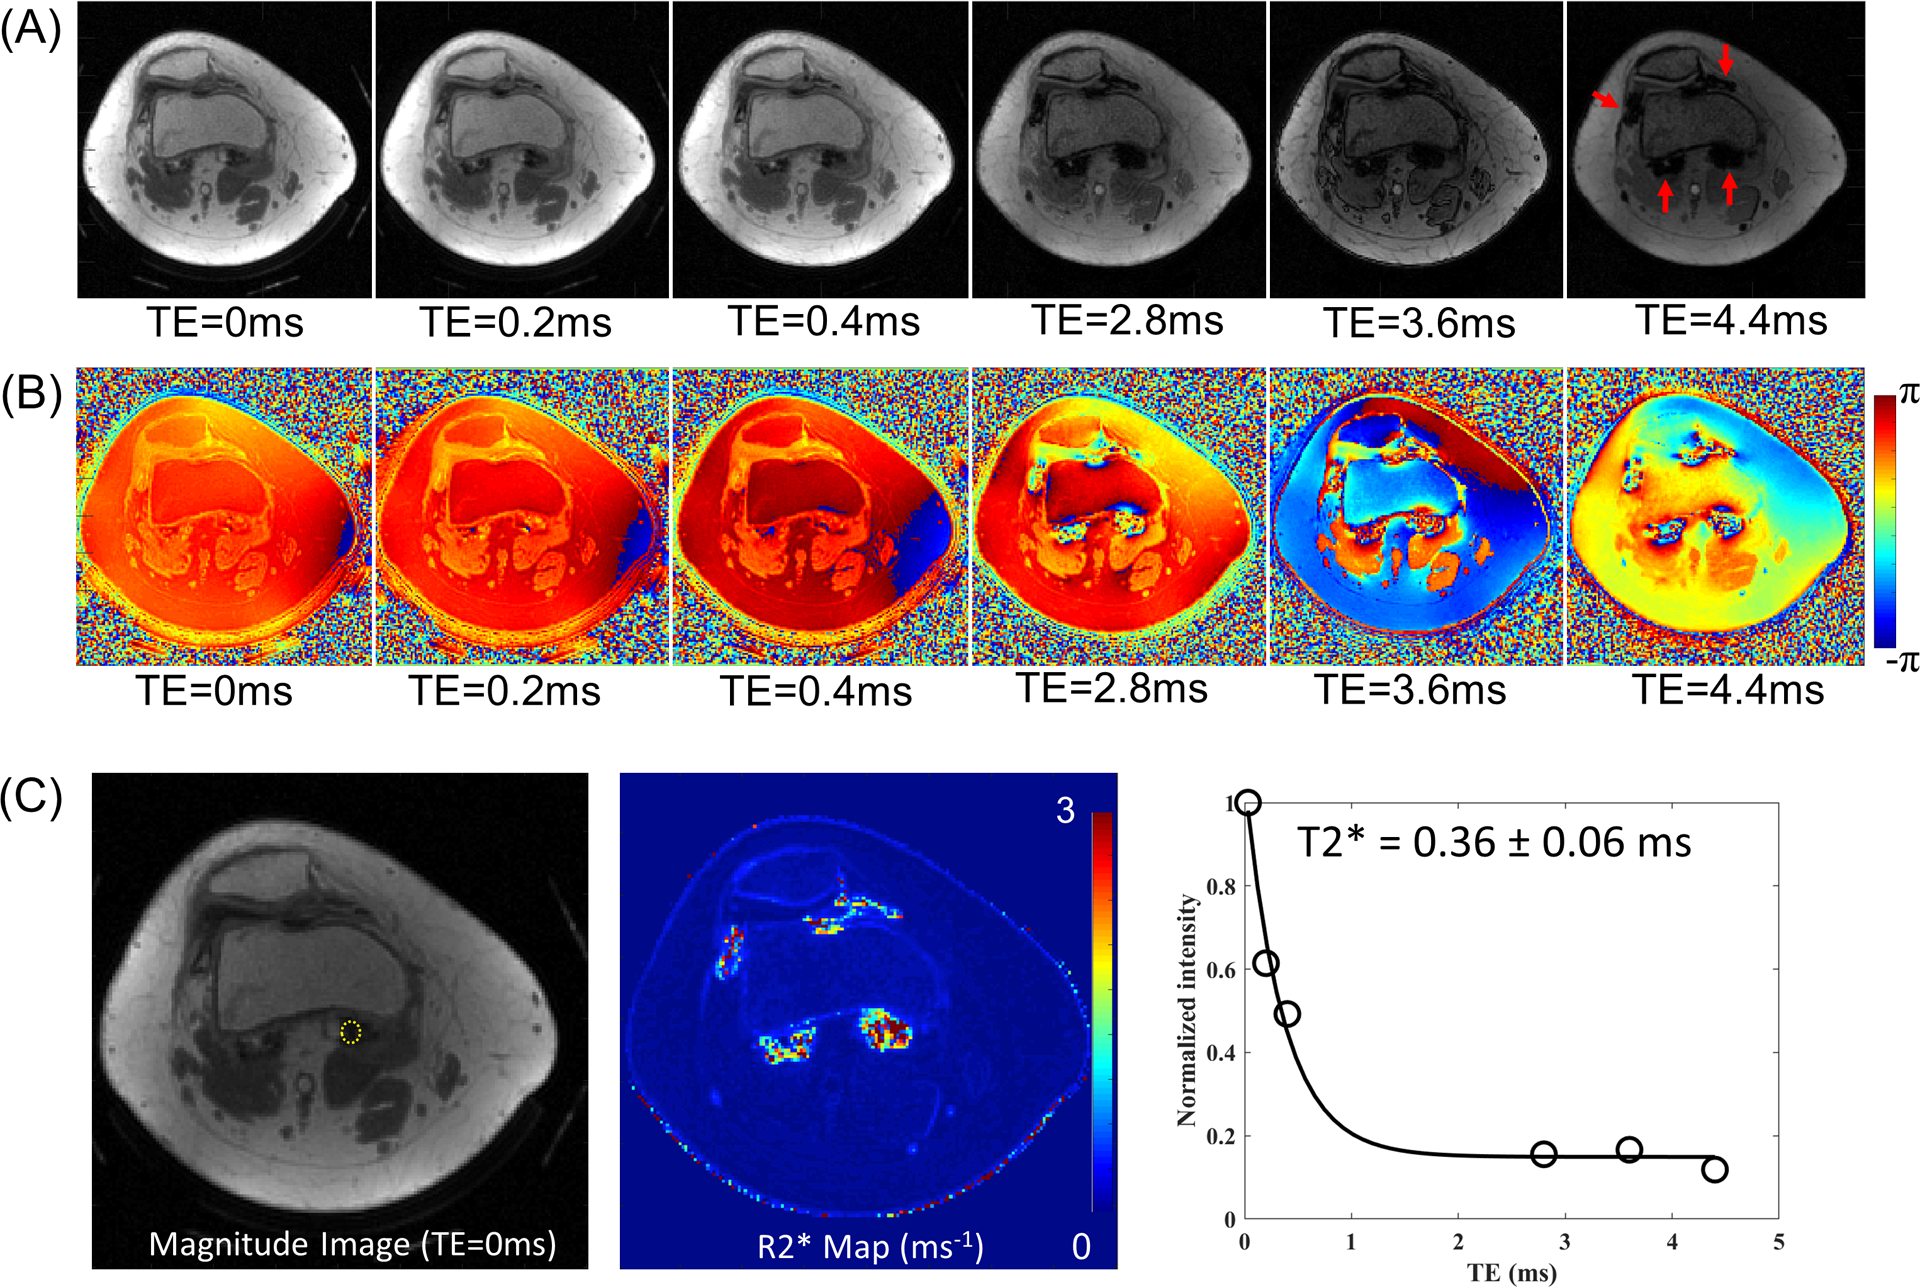
Figure 3.

Reconstructed images from Patient A. (A) Magnitude and (B) phase images, and (C) a region of interest (yellow dotted line) in magnitude image at TE of 32 μs (left), the estimated R2* map from IDEAL (middle), and signal decay and T2* estimation (right). Rapid signal decay is shown in the regions indicated by red arrows in (A), which is due to the highly concentrated hemosiderin. The measured T2* in one region (yellow circle in C) is 0.36 ± 0.06 ms, which is impossible to capture with clinical MR sequences with long TE.
