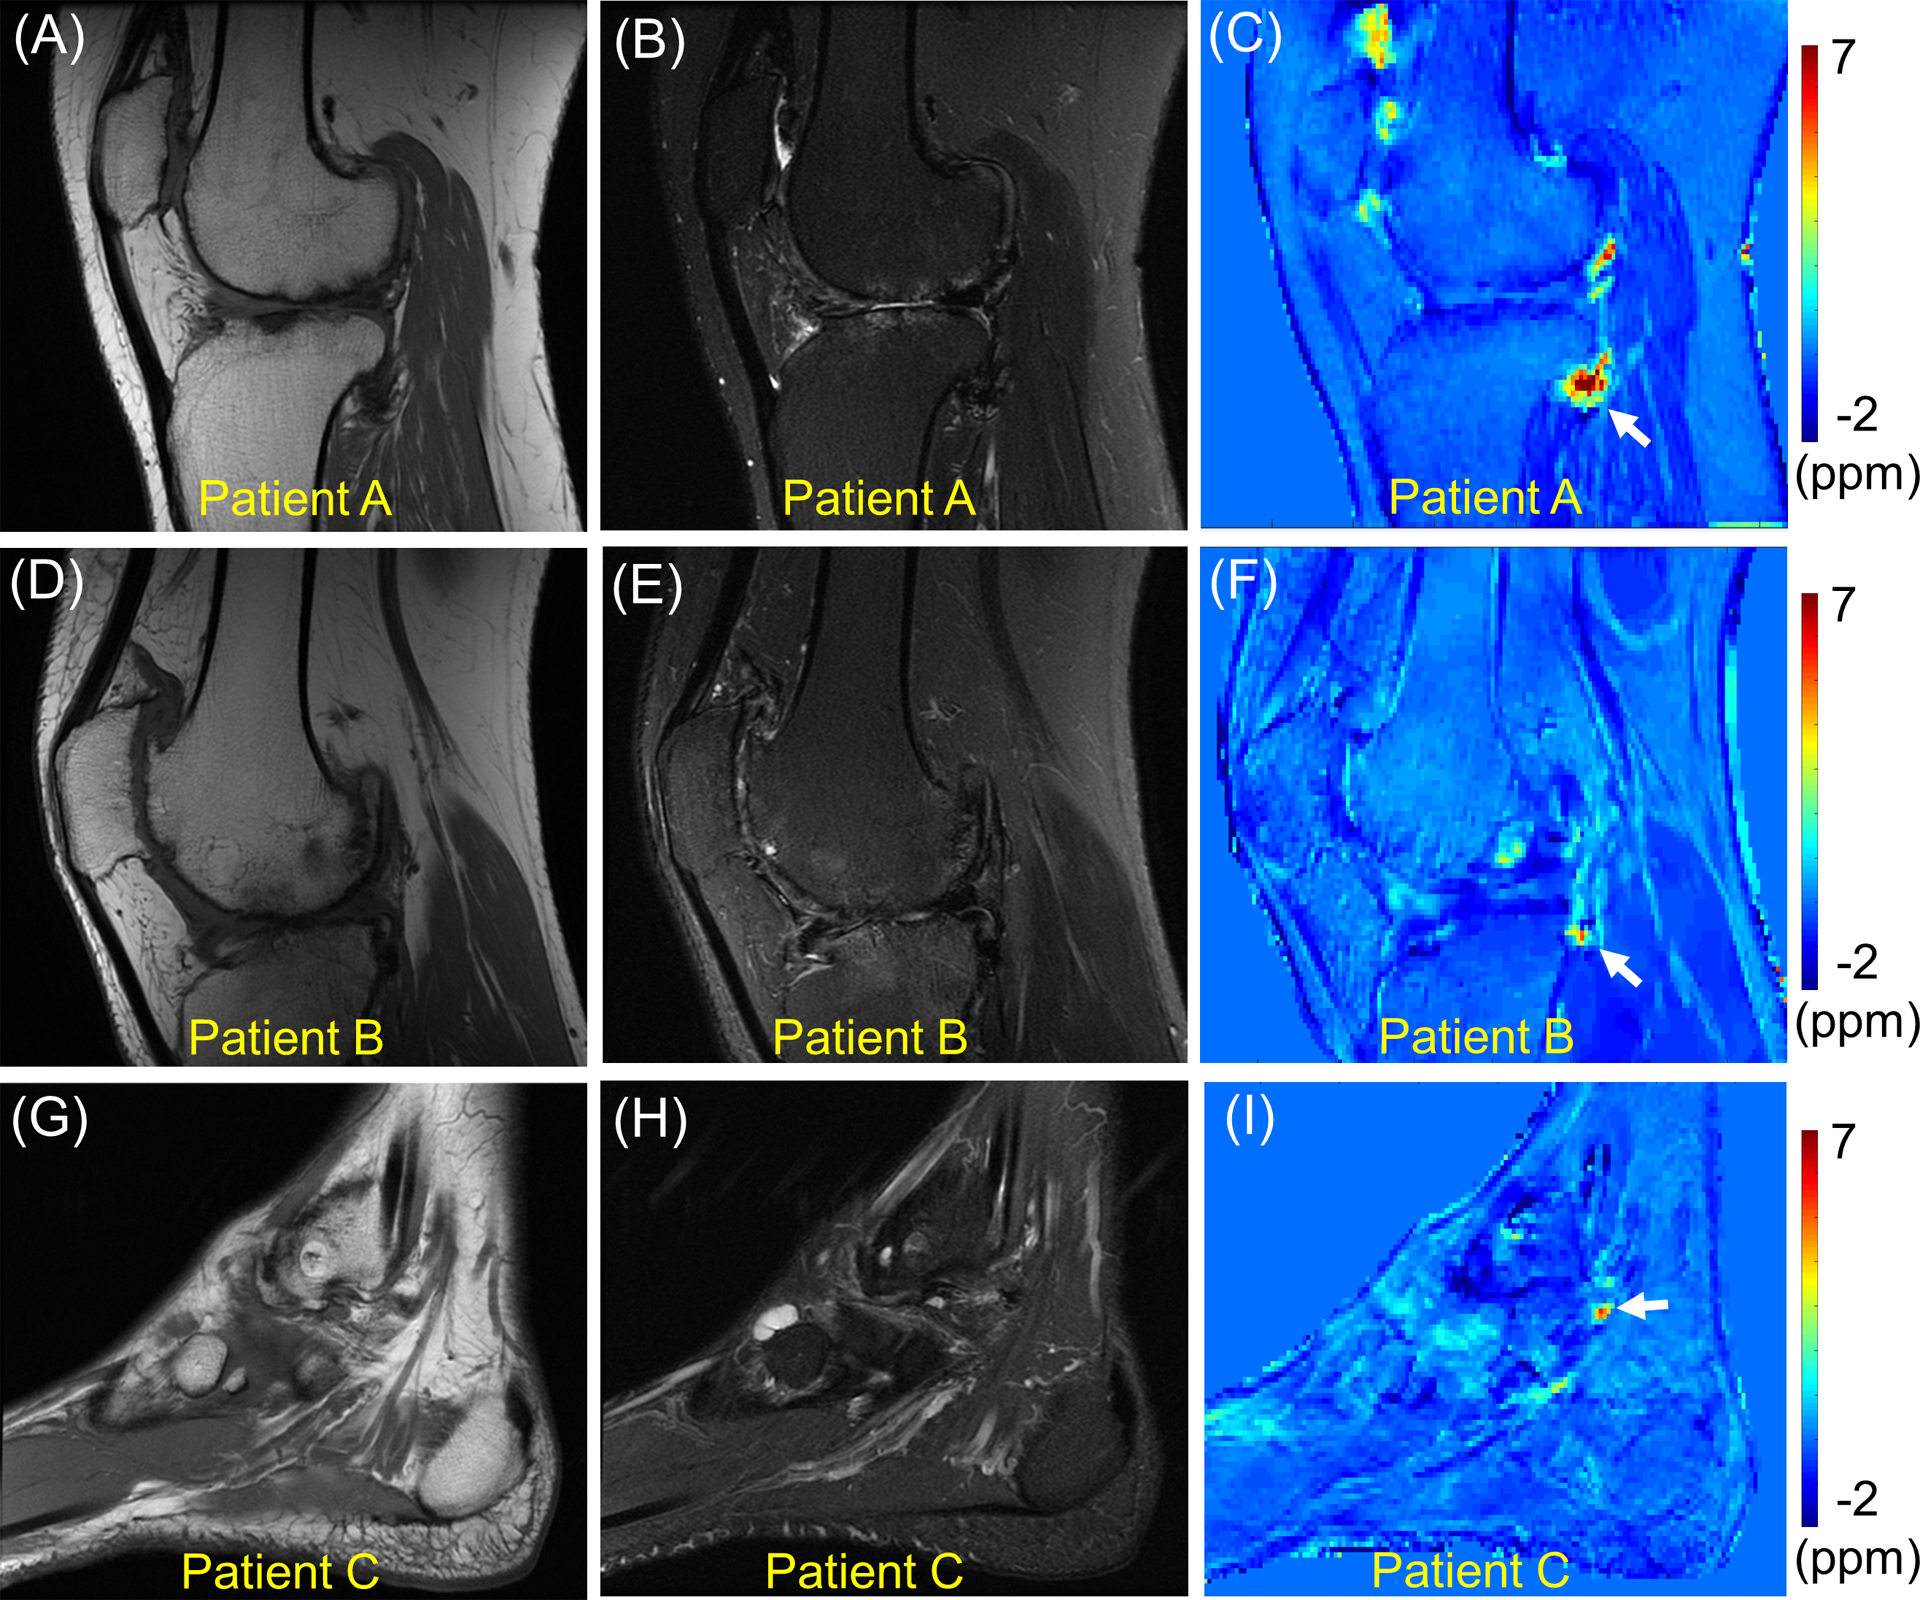
Figure 5.

Clinical MR images and QSM in all three hemophilic patients. T1-weighted MRI (A, D, G), T2-weighted MRI (B, E, H), and QSM (C, F, I). The susceptibility estimated in the regions of interest indicated by white arrows are 4.9 ± 2.5 ppm, 2.4 ± 1.6 ppm, and 2.3 ± 1.9 ppm for Patients A, B, and C, respectively.
