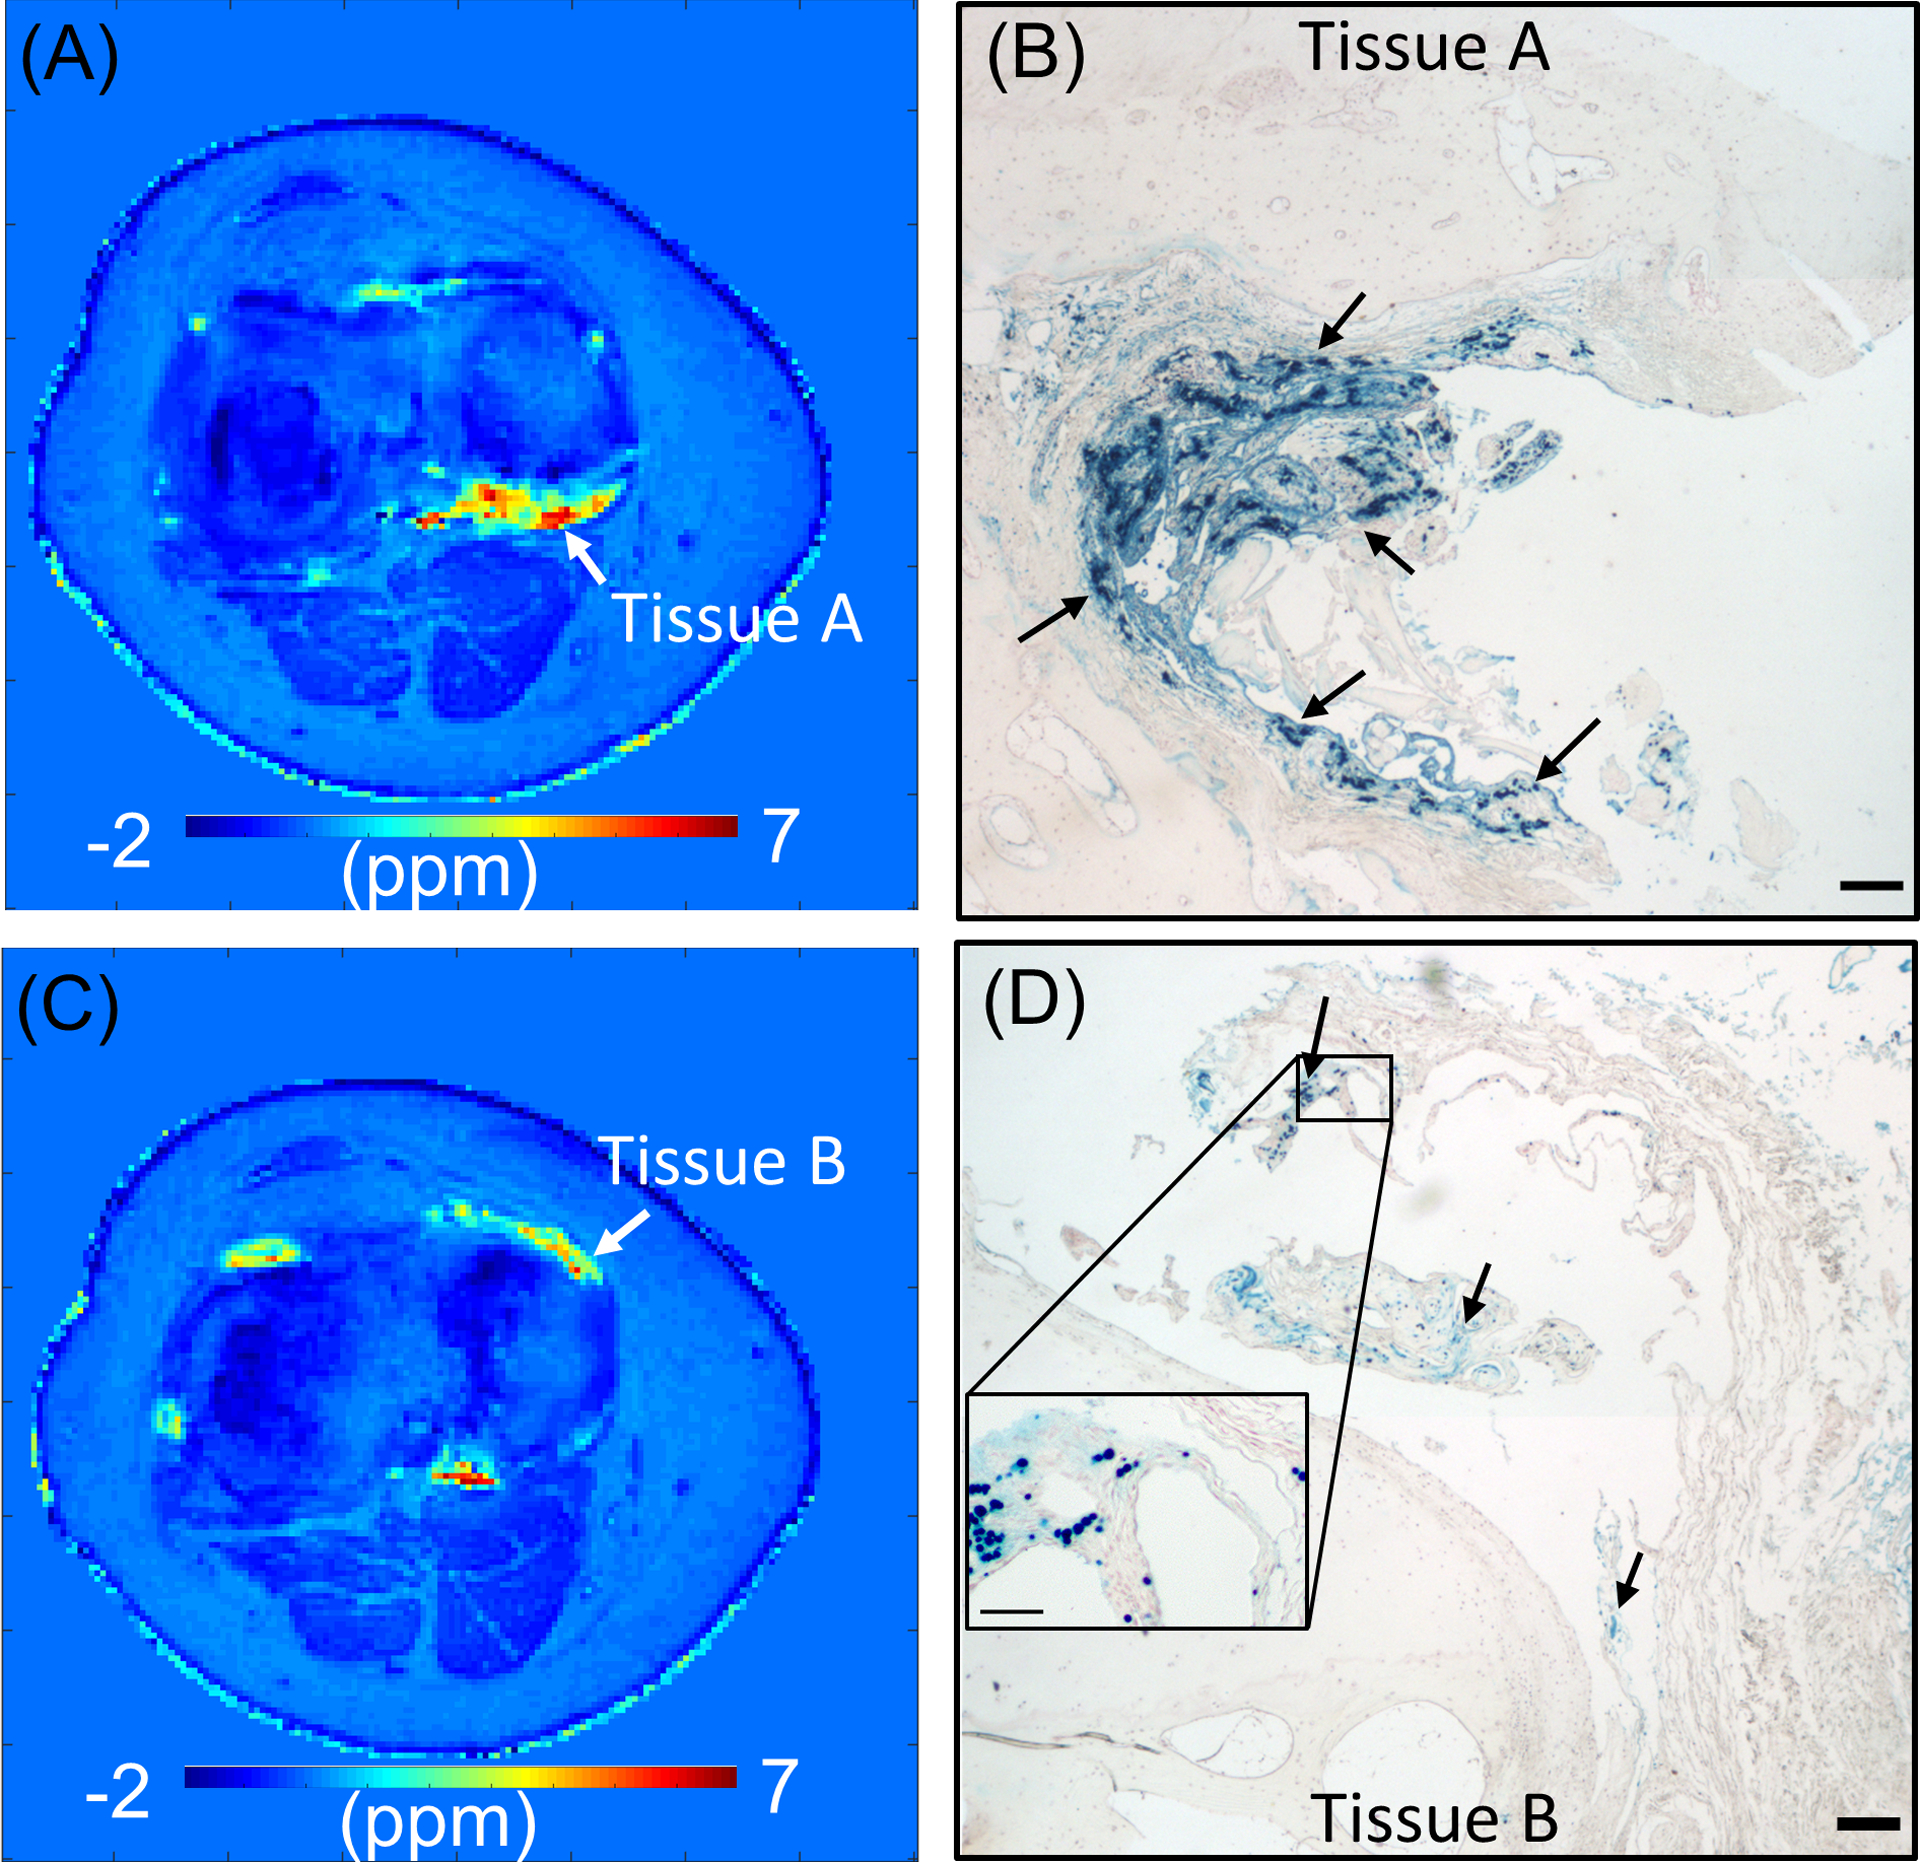
Figure 6.

Histology of osteochondral tissues from Patient A. Susceptibility map estimated in two representative slices (A and C) and the corresponding histological images (B and D). Perl’s reaction product (blue) in B and D demonstrate iron (arrows) with a concentration-dependent intensity, primarily shown in hypertrophic synovial tissue adherent to the joint. Bars represent 200 microns in widefield images and 50 microns in insets. Red hematoxylin counterstain was applied. The measured susceptibility with UTE-QSM is 4.5 ± 1.8 ppm for Tissue A and 2.7 ± 1.1 ppm for Tissue B, which agrees with the observation that Tissue A shows higher iron concentration than Tissue B in histology.
