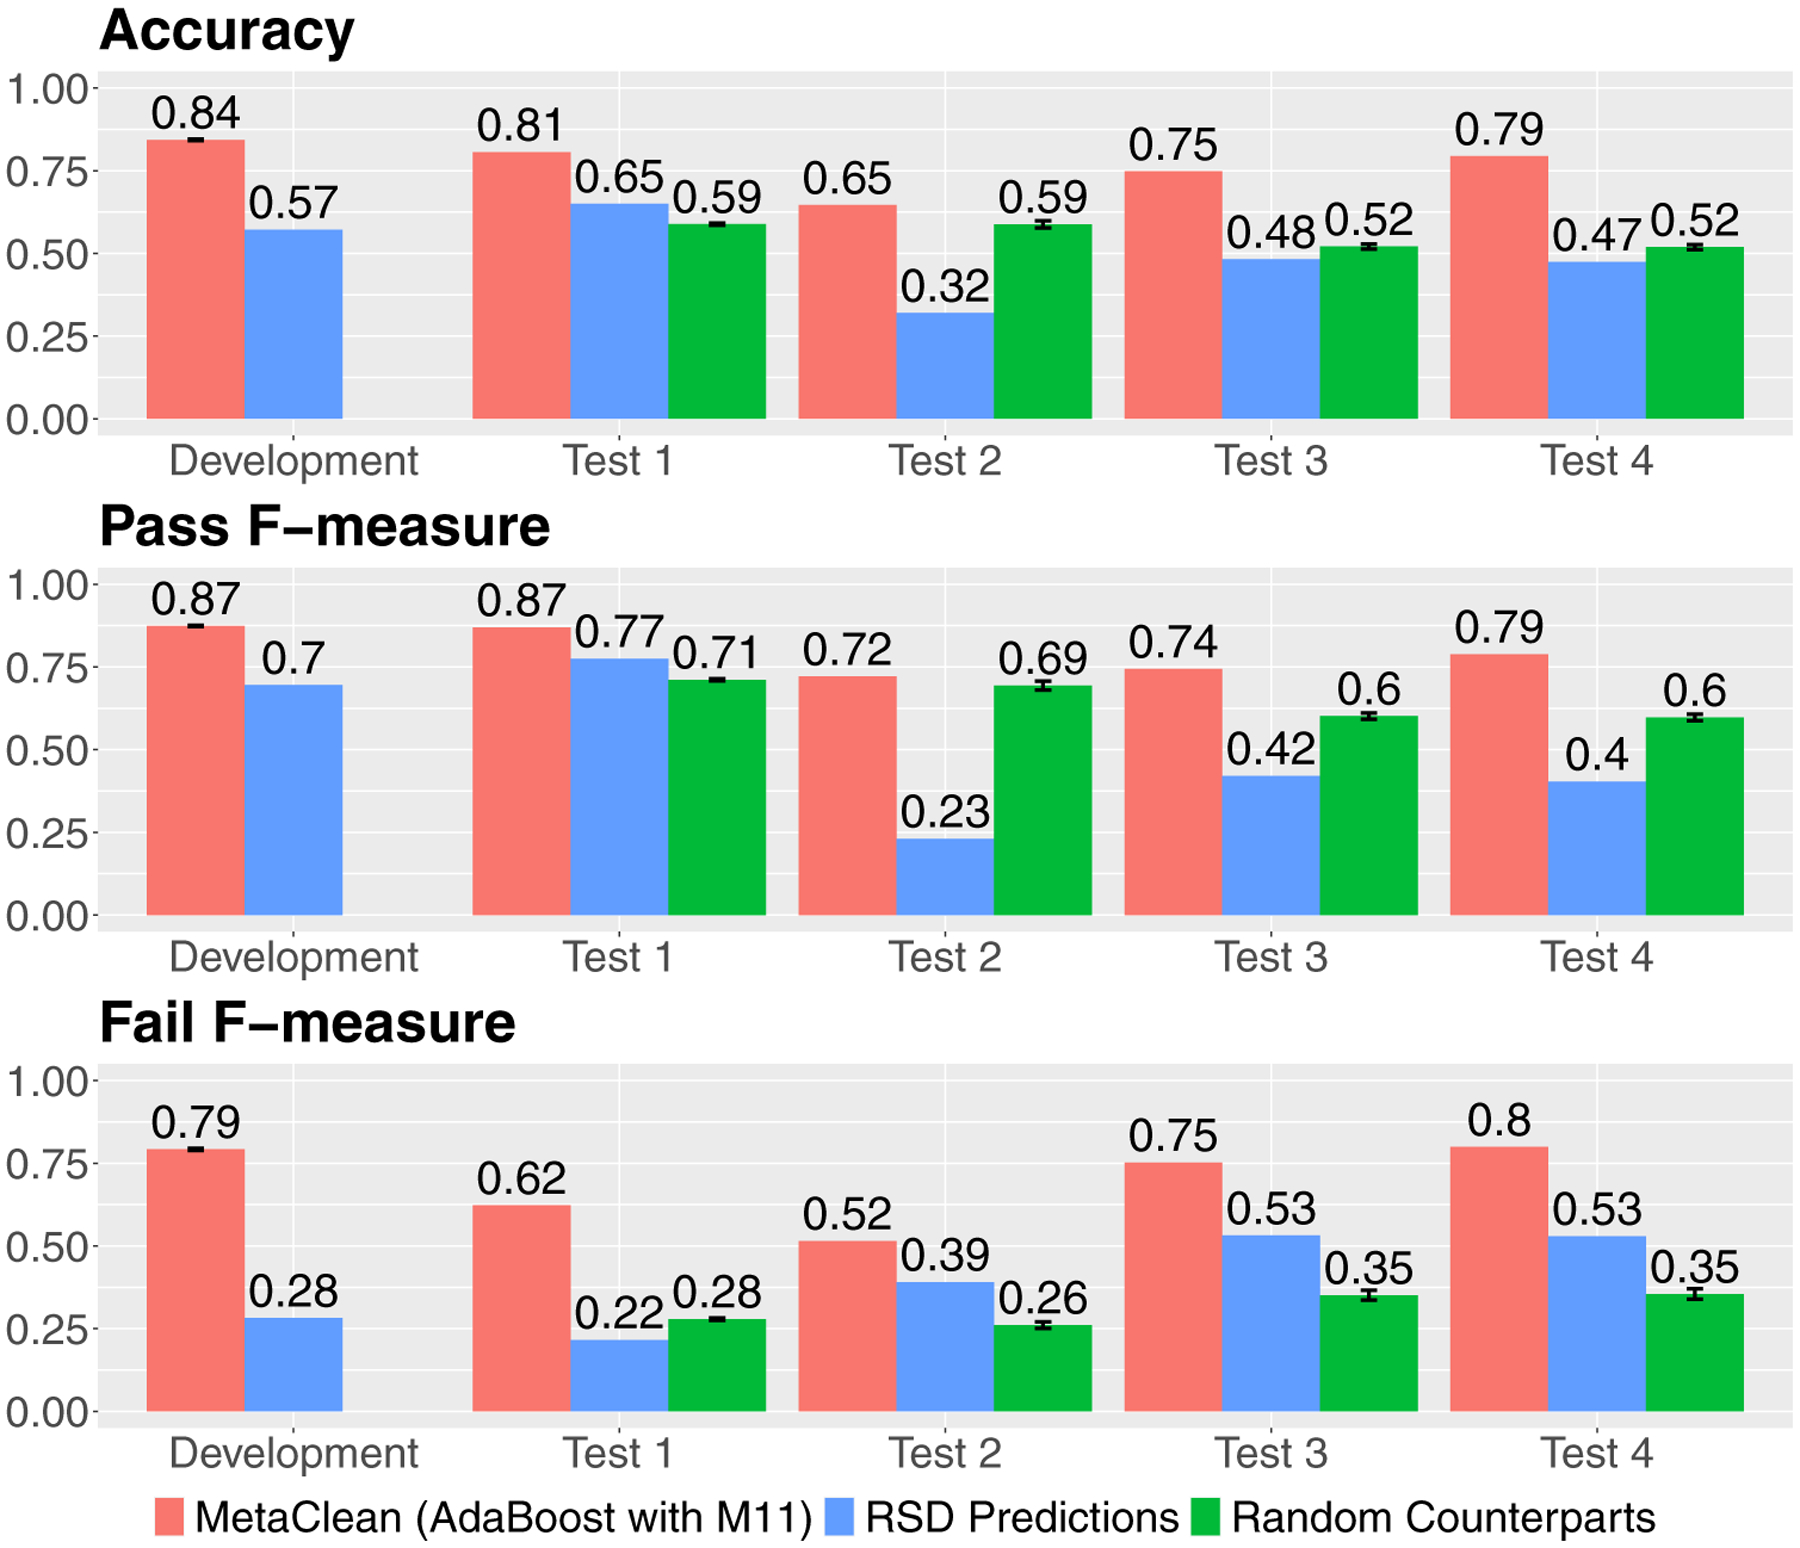
Fig. 4.

The performance of the global peak quality classifier on the development set and four independent test sets (Test 1–4), in terms of accuracy, and F-measures for the Pass and Fail classes. Shown here are the performances of the global AdaBoost with M11 classifier (red bars), pooled QC filtering by RSD < 30% (blue bars), and the random counterparts of the global classifier (green bars). These results show that the performance of the global classifier generalized very well to data generated from the same platform (Test 1), and reasonably well to data from other platforms (Test 2–4). The classifier also performed consistently better than filtering by RSD < 30%. In addition, across all these comparisons, the real global classifier performed much better than its random counterparts, indicating that the observed results weren’t due to random chance
