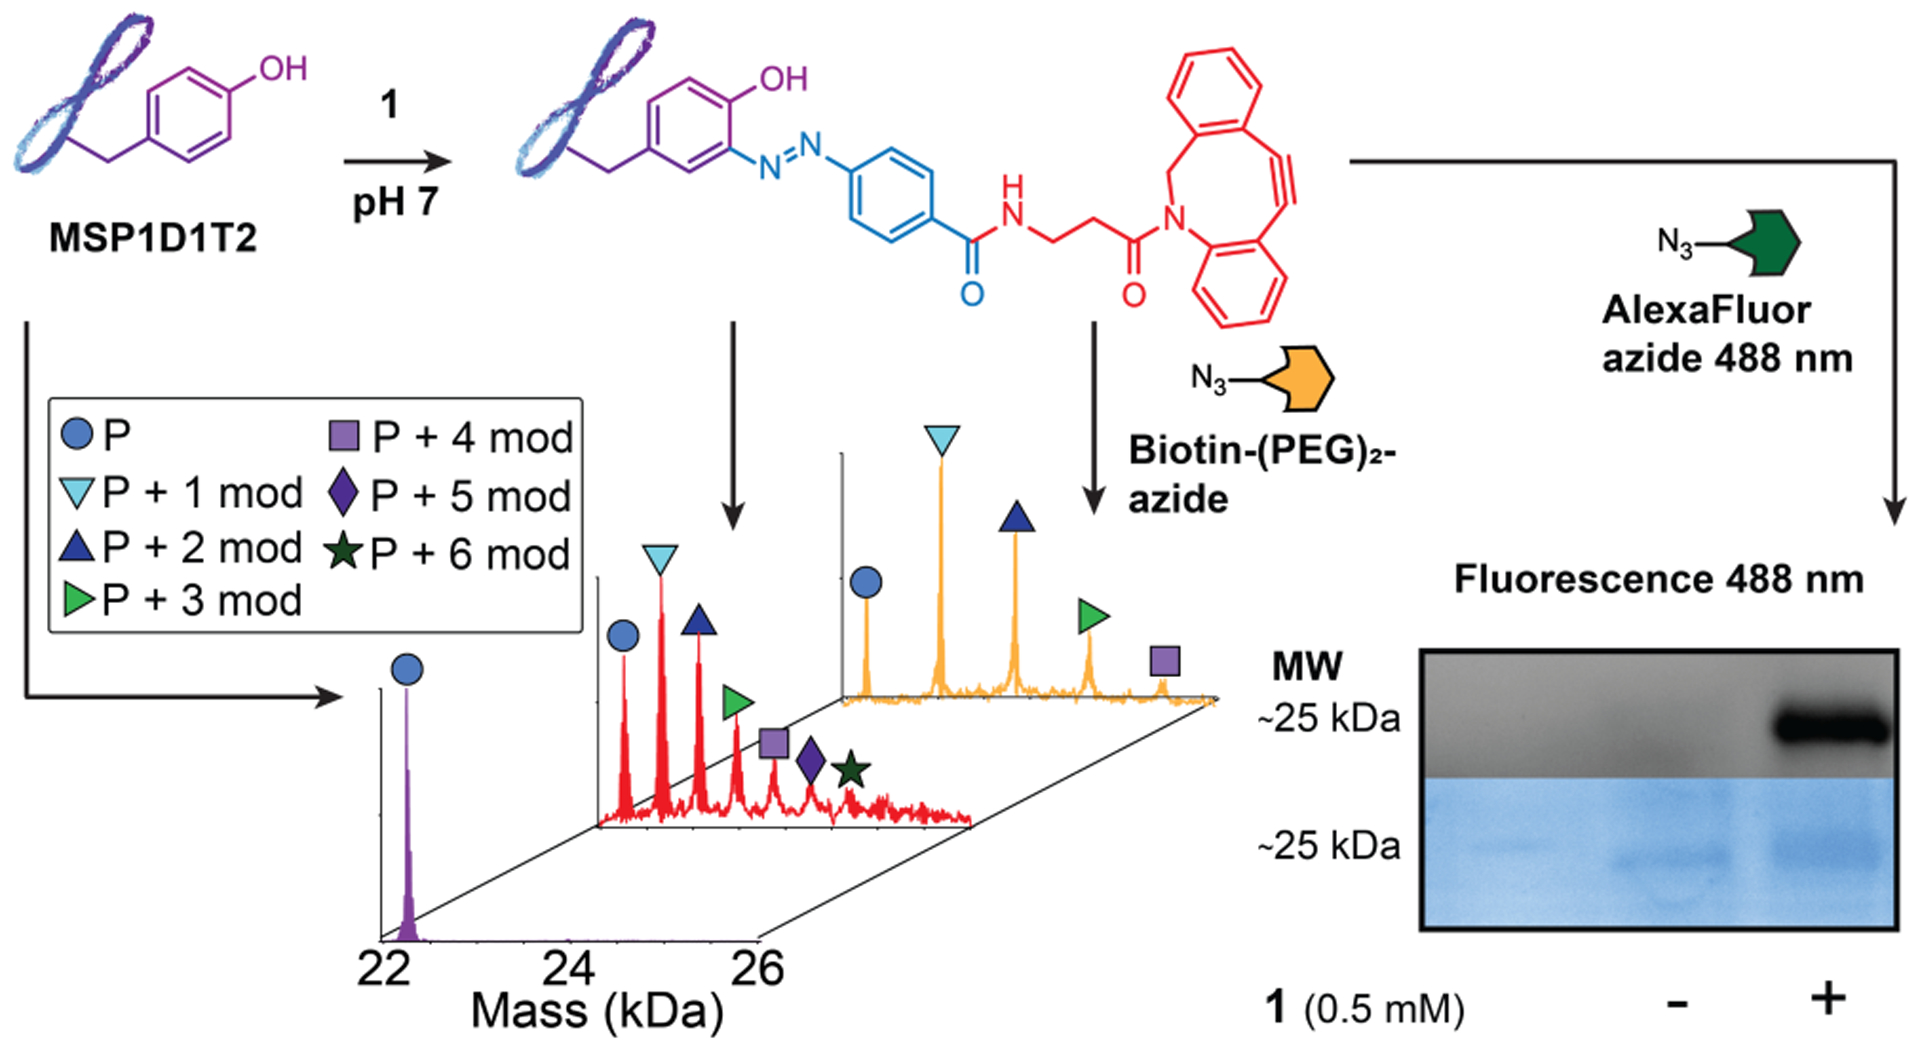
Figure 3.

The extent of protein labeling was quantified using a membrane scaffold protein (MSP1D1T2(−)), as a small model protein. MSP (mass spectrum in purple) was first incubated with 1 at pH 7 to provide a cyclooctyne-modified MSP (mass spectrum in red). At this point part of the sample was split. One portion was treated with a fluorescent azide and the modification was observed by SDS-PAGE. The second portion was treated with a biotin-containing azide (mass spectrum shown in orange). Masses corresponding with integer-values of the appropriate modifications were observed and are noted with symbols (P = MSP protein, mod = chemical modification)
