
Fig. 7.
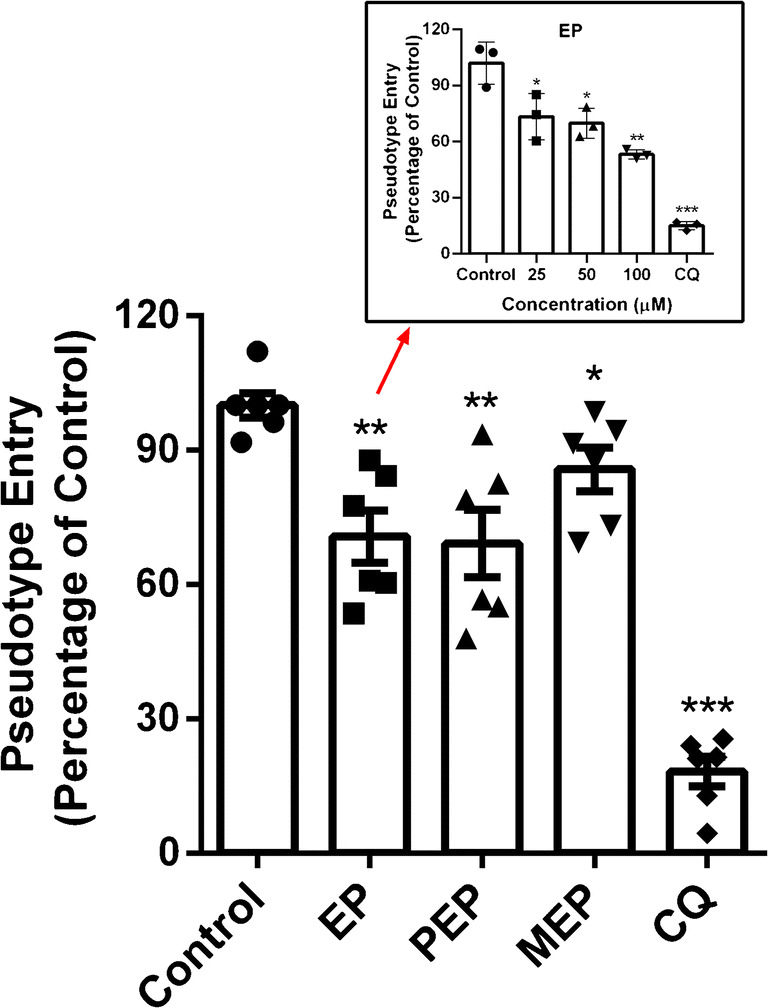
Effect of EP, PEP and MEP on the entrance of SARS-CoV-2 spike pseudovirus into ACE2h cells. Inset is the graph of EP. Data are presented as mean ± SD. *P ˂ 0.05, **P ˂ 0.01, ***P ˂ 0.001 compared with group Control
Official websites use .gov
A
.gov website belongs to an official
government organization in the United States.
Secure .gov websites use HTTPS
A lock (
) or https:// means you've safely
connected to the .gov website. Share sensitive
information only on official, secure websites.
Effect of EP, PEP and MEP on the entrance of SARS-CoV-2 spike pseudovirus into ACE2h cells. Inset is the graph of EP. Data are presented as mean ± SD. *P ˂ 0.05, **P ˂ 0.01, ***P ˂ 0.001 compared with group Control