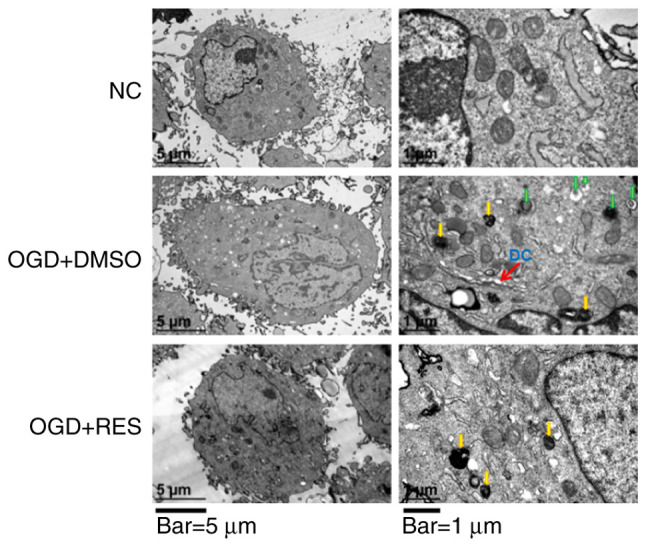
Figure 2.

TEM images showing the ultrastructural findings in H9C2 cells. Yellow arrows in the images on the right indicate primary lysosomes. Green arrows in the images on the right indicate autophagic vesicles. DC, dilated cisternae of endoplasmic reticulum. Scale bars, 5 µm (left panels) and 1 µm (right panels). Images were obtained using 2 different magnifications: ×8,000 and ×30,000. RES, resveratrol; OGD, oxygen-glucose deprivation.
