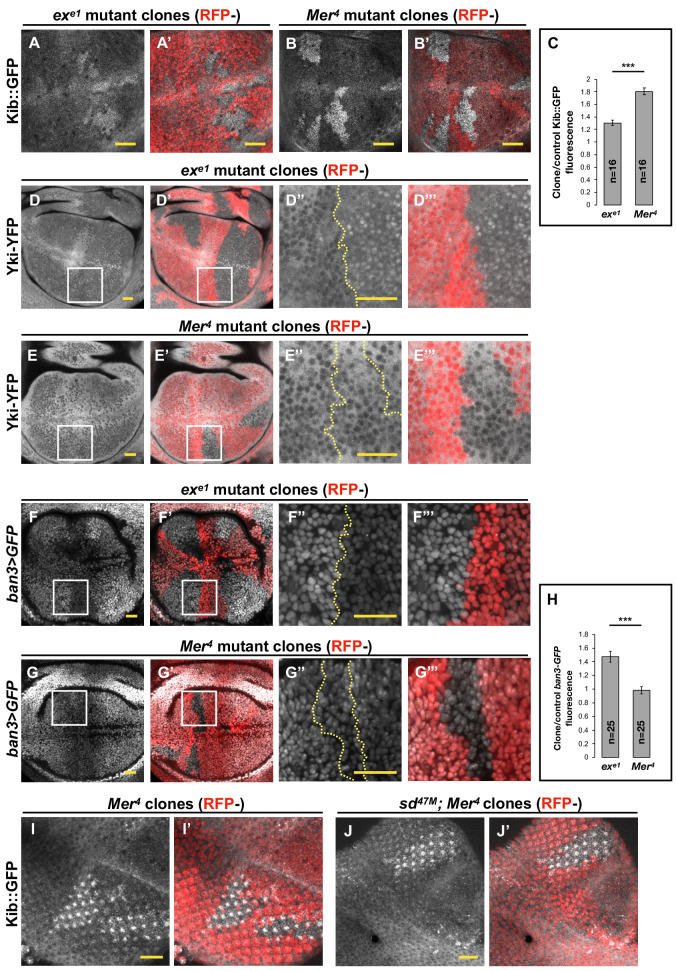
Figure 1. Transcriptional feedback alone does not explain Kibra (Kib) upregulation in Mer clones.
(A–G’’’) All tissues shown are living late third instar wing imaginal discs expressing the indicated fluorescent proteins. (A–C) Endogenous Kib::GFP in ex (A and A’) or Mer (B and B’) somatic mosaic clones (indicated by loss of RFP). Loss of Mer leads to a greater increase in Kib levels than loss of Ex. Quantification is shown in (C). (D–E’’’) Endogenously expressed Yorkie (Yki)-YFP is strongly nuclear in ex mutant clones (D–D’’’) but is mostly cytoplasmic in Mer mutant clones (E–E’’’). (F–H) Expression ban3>GFP, a reporter of Yki activity, is elevated in ex mutant clones (F–F’’’) but is not detectably affected in Mer mutant clones (G–G’’’). Quantification is shown in (H). (I–J’) Endogenous Kib:GFP levels are elevated in single Mer somatic mosaic clones (I and I’) and in double sd; Mer clones (J and J’). Yellow dashed lines indicate clone boundaries. All scale bars=20 μm. Quantification in (C) and (H) is represented as the mean ± standard error of the mean (SEM); n=number of clones (no more than two clones per wing disc were used for quantification). Statistical analysis was performed using nonparametric Mann–Whitney U-test. Throughout the paper, statistical significance is reported as follows: ***p≤0.001, **p≤0.01, *p≤0.05, ns (not significant, p>0.05).

