. 2021 Jan 15;10:e61037. doi: 10.7554/eLife.61037

Figure 1. Confinement induces an amoeboid phenotype in the choanoflagellate S. rosetta.

(A) Free-swimming cells (bottom left) were confined (bottom right) at a fixed height using confinement slides with micro-spacers (Liu et al., 2015; Le Berre et al., 2014) (top). (B) Confined S. rosetta cells underwent a rapid phenotypic transition, first from a flagellate form into an amoeboflagellate form, and eventually into an amoeboid form (that initially retains microvilli). Releasing confinement reversed this transition. (C and D) Confinement height correlated with the phenotypic switch. (C) Representative cells at each confinement height tested. (D) The flagellate form dominated at >3 μm confinement and the amoeboid form (defined by the presence of dynamic protrusions) at <3 μm. The number of cells (technical replicates) per batch (biological replicate) was as follows: 14, 6, and 12 cells for 5 μm confinement; 5, 5, and 11 cells for 4 μm confinement; 28, 18, and 6 cells for 3 μm confinement; 11, 5, and 6 cells for 2 μm confinement; and 13, 11, and 21 cells for 1 μm confinement. (EJ) Time series of an S. rosetta cell switching to the amoeboid form at 2 μm confinement. See Figure 1—video 1 for multiple examples. (KP) Time series of an amoeboid S. rosetta cell reverting to the flagellate form after release from confinement. See Figure 1—video 2 for multiple examples. In all panels, white arrowheads indicate dynamic protrusions, black arrowheads indicate collar microvilli, and black arrows indicate the flagellum. Time stamps in black boxes shown as min:sec.

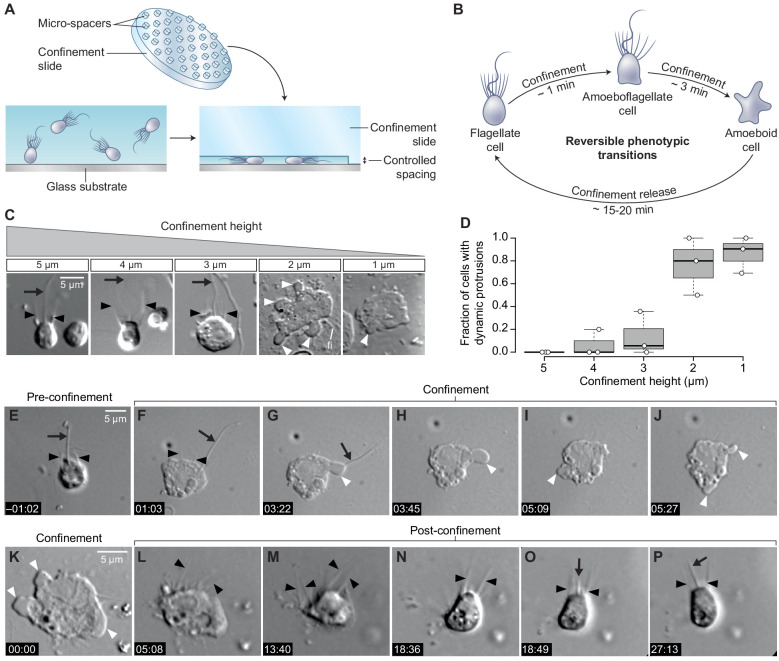
Figure 1.

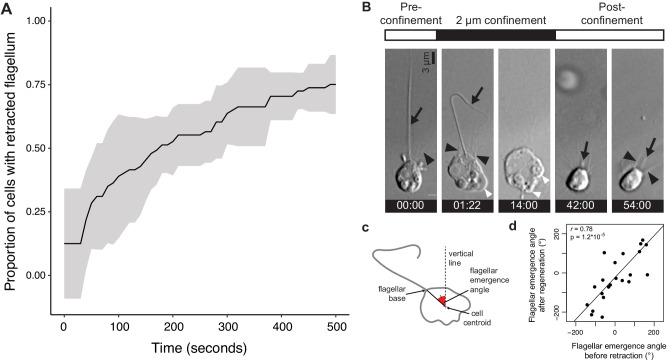
Figure 1—figure supplement 1. Flagellar retraction and regeneration during transitions between the flagellate and amoeboid forms.

Figure 1—figure supplement 1.

(A) Most (but not all) S. rosetta cells retracted their flagellum within 500 s of confinement at 2 μm. (BD) The flagellum regenerated after release from confinement in approximately the same position as the original, retracted flagellum. (B) Time series of an S. rosetta cell retracting its flagellum under confinement and regenerating it after confinement release (Figure 1—video 2). The cell was attached to the glass substrate with poly-d-lysine to minimize cell movements. White arrowheads: dynamic protrusions, black arrowheads: microvilli, black arrow: flagellum. Time stamps in black boxes are min:sec. (Figure 1—video 2). (C) To compare the flagellar position before and after confinement, the flagellar emergence angle was measured relative to an invariant vertical line (parallel to the edge of the field of view). (D) The position of the regenerated flagellum after release from confinement in a population of cells was almost always close to the position of the original, retracted flagellum (as measured by the flagellar emergence angle; Figure 1—video 2). The cells sometimes underwent slight global reorientations under confinement (even though they were attached to the substrate with poly-d-lysine) that likely accounted for small differences in flagellar angle before and after confinement.
Figure 1—figure supplement 2. S. rosetta is competent to undergo the amoeboid switch in rosette and thecate forms.

Figure 1—figure supplement 2.

(A) Schematic drawing of a rosette colony of S. rosetta (from Brunet and King, 2017). (BE) Cells within rosettes became amoeboid under 2 μm confinement. (A) An unconfined rosette. (C and D) Time series of a confined rosette, showing dynamic extension and retraction of protrusions. All cells switched to an amoeboid phenotype, but we did not observe any evidence of collective behavior (Figure 1). (E) Quantification of the amoeboid switch in rosettes from two biological replicates. Numbers refer to individual cells. (F) Schematic drawing of a thecate S. rosetta cell (from Brunet and King, 2017). Thecate cells are sessile and attached to the substrate through an extracellular lodge called a ‘theca’. (GJ) Thecate cells become amoeboid under 2 μm confinement. (G) An unconfined thecate cell. (H and I) A confined thecate cell, showing dynamic extension and retraction of protrusions. (J) Quantification of the amoeboid switch in a population of confined thecate cells. In all panels, white arrowheads: dynamic protrusions, black arrowheads: microvilli, black arrow: flagellum. Time stamps in black boxes are min:sec.
Figure 1—video 1. Time-lapse of a population of S. rosetta cells before and during 2 μm confinement under a confinement slide controlled by a dynamic cell confiner.
Download video file (13.2MB, mp4)
The strain used was SrEpac and the starting cell type was slow swimmer.
Figure 1—video 2. Time-lapse of a population of S. rosetta cells before, during and after 2 μm confinement under a confinement slide controlled by a dynamic cell confiner.
Download video file (15.2MB, mp4)
Cells were attached to the substrate by poly-d-lysine to minimize cell movement and help visualizing both conversion of flagellates into amoeboid cells, and reversion of amoeboid cells back into flagellates. For this reason, cells show less crawling movements (compare Figure 1—video 1). The strain used was SrEpac and the starting cell type was slow swimmer.