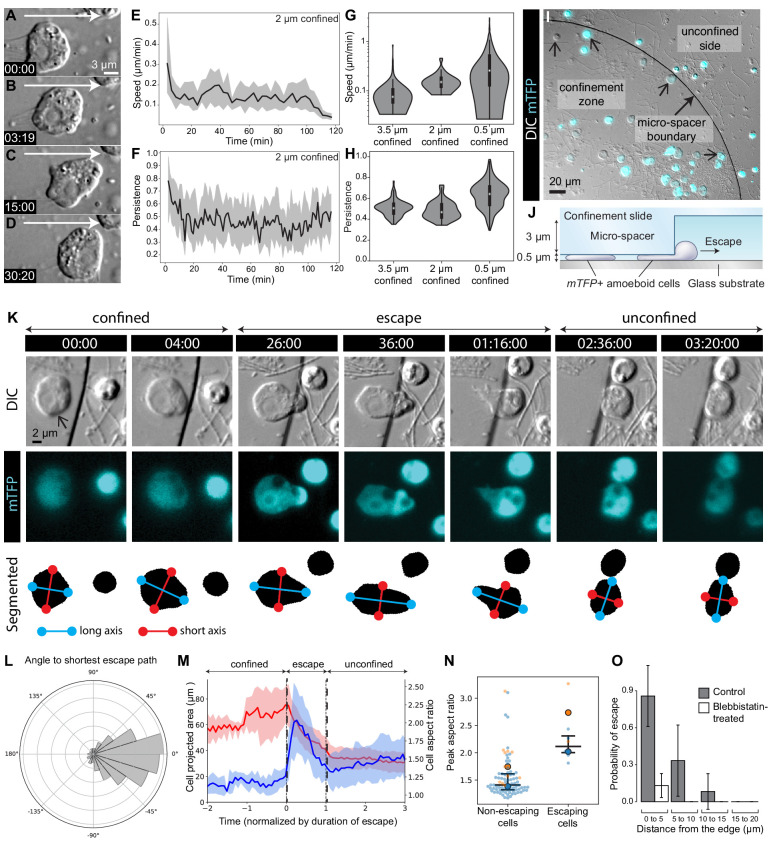
Figure 5. The amoeboid switch allows escape from confinement.
(A–D) Amoeboid cell crawling after flagellar retraction (Figure 1—video 1). White arrow indicates direction of movement. (E and F) Speed and directional persistence of the cells in Figure 1—video 1 (2 μm confinement). Directional persistence was defined as the ratio of the total path to the Euclidean distance over 2 min. (G and H) Violin plots showing speed and directional persistence measured over 100 min under 0.5 μm (Figure 5—video 1, non-escaping cells under the micropillar – see following panels), 2 μm (Figure 1—video 1), and 3.5 μm (Figure 5—video 1, cells outside the micropillar – see following panels) confinement. (I) mTFP-expressing S. rosetta cells (cyan; confined cells that escaped during the assay indicated with small arrows) distributed within and outside the confinement zone (border indicated with larger arrow) at the beginning of an escape assay (Figure 5—video 1). (J) Schematic of cross-section through escape assay set-up from (I). (K) Time series of an mTFP-expressing cell (arrow) during escape from confinement (top, DIC; middle, mTFP; bottom, segmentation of mTFP fluorescence to reveal cell shape; Figure 5—video 2). Automated detection of the long (blue) and short (red) axes of the cell revealed that the cell elongated during crossing of the confinement border and relaxed into a more rounded shape once escape was complete. (L) Cells crawled directionally during escape. Bullseye diagram showing the distribution of angular differences between crawling and the shortest possible escape path in escaping cells (N = 8). (M) Escaping cells (N = 8) consistently elongated during escape and resumed a rounder shape once in the unconfined area. Escape also corresponded to a decrease in the projected area of the cell. Mean aspect ratio (red line) and projected area (blue line), ribbons: standard deviation. (N) Escaping cells acquired a highly elongated shape. Non-escaping cells did not reach comparable elongation levels, as indicated by the peak aspect ratio. Results are depicted as a SuperPlot (Lord et al., 2020) with biological replicates (time-lapse movies of a cell population) represented as large dots and technical replicates (individual cells within each movie) as small dots. Replicate 1 (blue dots) included 81 cells of which six escaped (p=2.2 × 10⁻⁴ by Mann–Whitney’s U test). Replicate 2 (orange dots) included 13 cells of which two escaped (p=3.0 × 10⁻² by Mann–Whitney’s U test). (O) Escape required myosin II activity. Control cells (three biological replicates with N = 95, 35, and 12 cells) almost always escaped confinement if they were initially located less than 5 μm away from the border, and some escaped from as far as 15 μm. Seventeen micromolar blebbistatin-treated cells (two biological replicates with N = 110 and 73 cells) virtually never escaped. Time stamps in black boxes shown as min:sec.


