
Fig. 5.
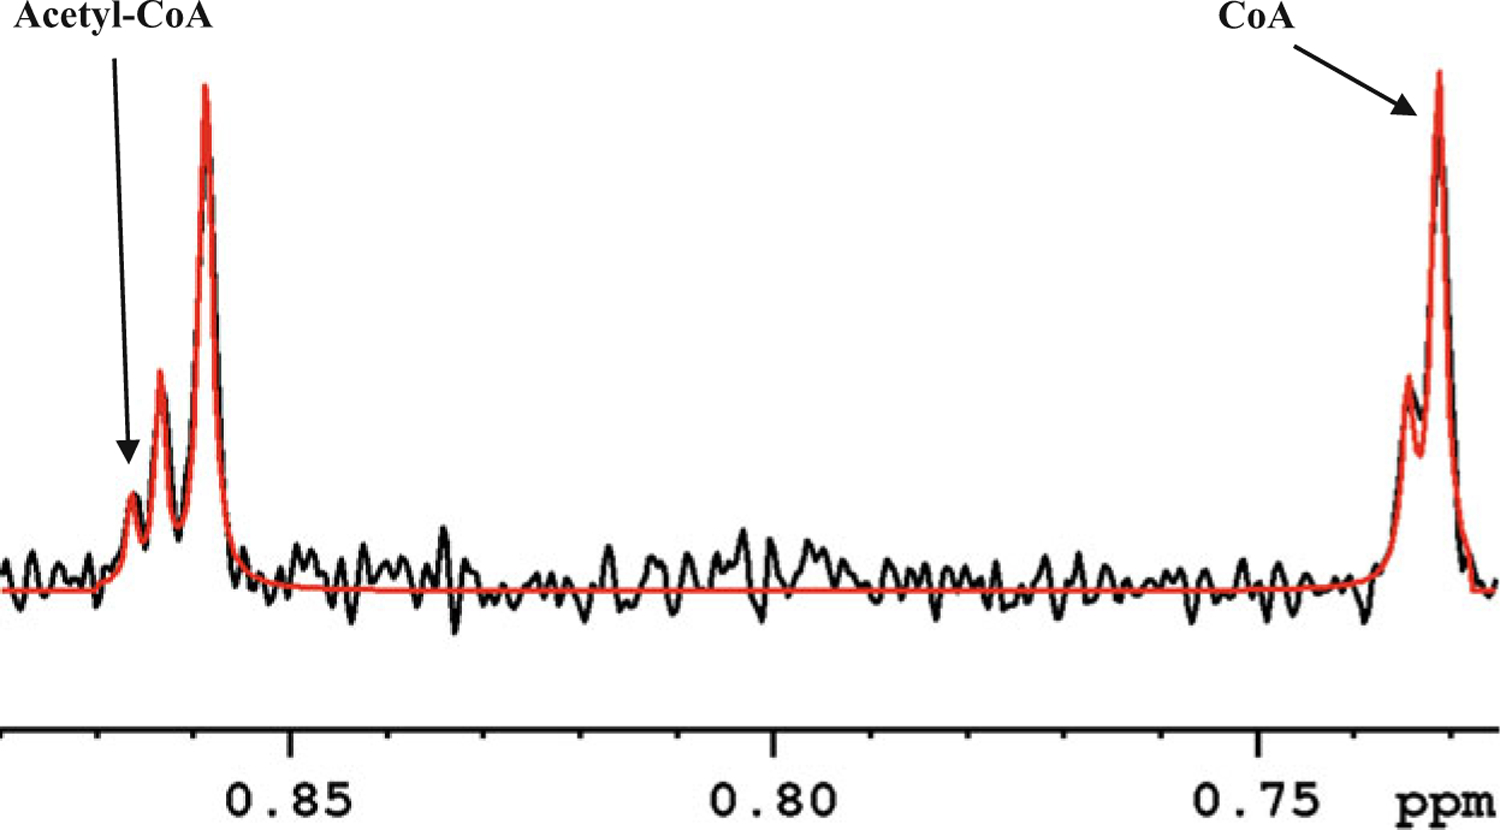
A portion of the 800-MHz 1H NMR spectrum of a typical mouse heart tissue extract highlighting deconvolution of the characteristic peaks of CoA and acetyl-CoA for peak integration: black, experimental spectrum; red, deconvoluted spectrum using Bruker TopSpin software