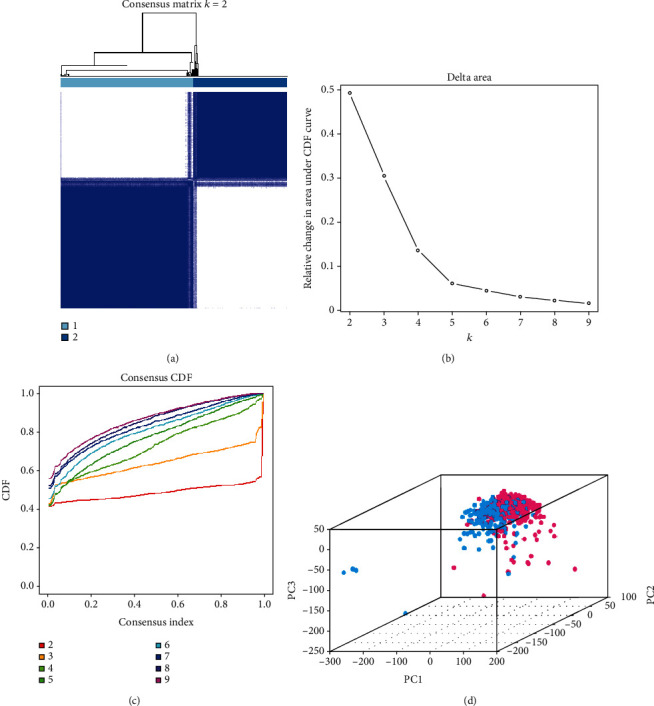
Figure 2.

Identification of consensus clusters by m6A RNA methylation regulators. (a) When k = 2: correlation between groups. (b) Relative change in the area under the cumulative distribution function (CDF) curve for k values from 2 to 9. (c) Consensus clustering CDF when k value ranges from 2 to 9. (d) Principal component analysis of the total RNA expression profile in the TCGA dataset (cluster 1 is marked in red and cluster 2 in blue).
