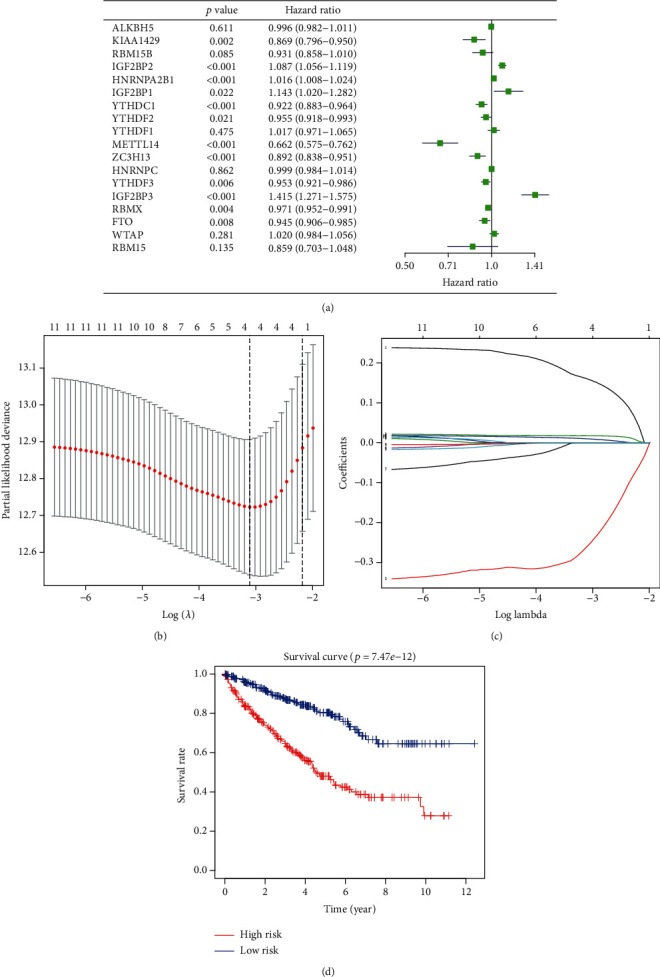
Figure 5.

Risk signature for ccRCC. (a) Hazard ratios (HRs) and 95% confidence intervals (CIs) were calculated using univariate Cox regression. (b, c) Coefficients calculated by the least absolute shrinkage and selection operator (LASSO) multivariate Cox regression algorithm. (d) Kaplan-Meier overall survival (OS) rate curve for high-risk (red) and low-risk (blue) groups of patients.
