Figure 2.

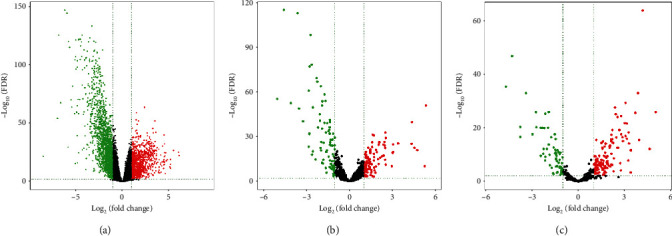
Volcano plots of the DE RNAs: (a) DE mRNAs, (b) DE lncRNAs, and (c) DE miRNAs. The green dots indicated downregulated DE RNAs and the red indicated upregulated DE RNAs in tumour samples. The black dots indicated excluded RNAs.

Volcano plots of the DE RNAs: (a) DE mRNAs, (b) DE lncRNAs, and (c) DE miRNAs. The green dots indicated downregulated DE RNAs and the red indicated upregulated DE RNAs in tumour samples. The black dots indicated excluded RNAs.