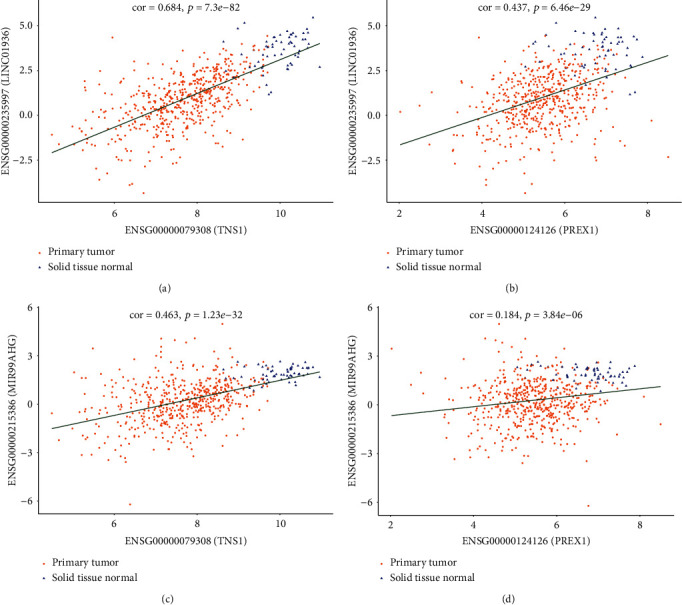
Figure 8.

Correlation analysis between lncRNAs and mRNAs of subnetwork: (a) LINC01936 and TNS1, (b) LINC01936 and PREX1, (c) MIR99HG and TNS1, and (d) MIR99HG and PREX1.

Correlation analysis between lncRNAs and mRNAs of subnetwork: (a) LINC01936 and TNS1, (b) LINC01936 and PREX1, (c) MIR99HG and TNS1, and (d) MIR99HG and PREX1.