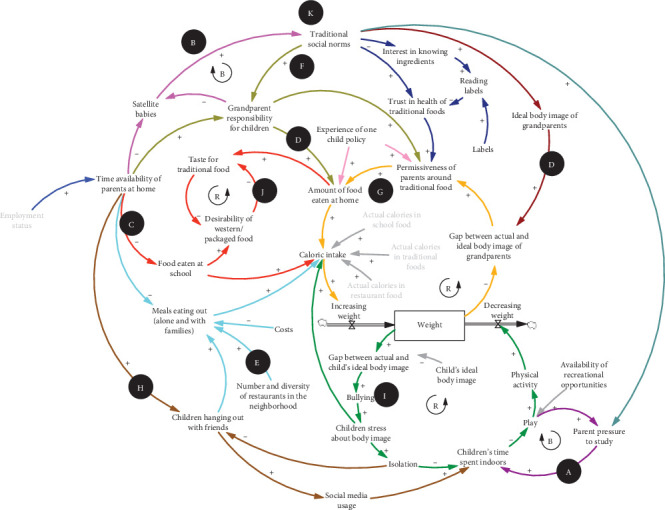
Figure 1.

Causal loop diagram (CLD) of childhood obesity in the sociocultural context of the community in Manhattan's Chinatown.  and
and  refer to reinforcing and balancing feedback loop, respectively. This CLD presents the local residents' view of childhood obesity-related factors and links among them. A through K illustrate subsystems of factors, links, and feedback loops.
