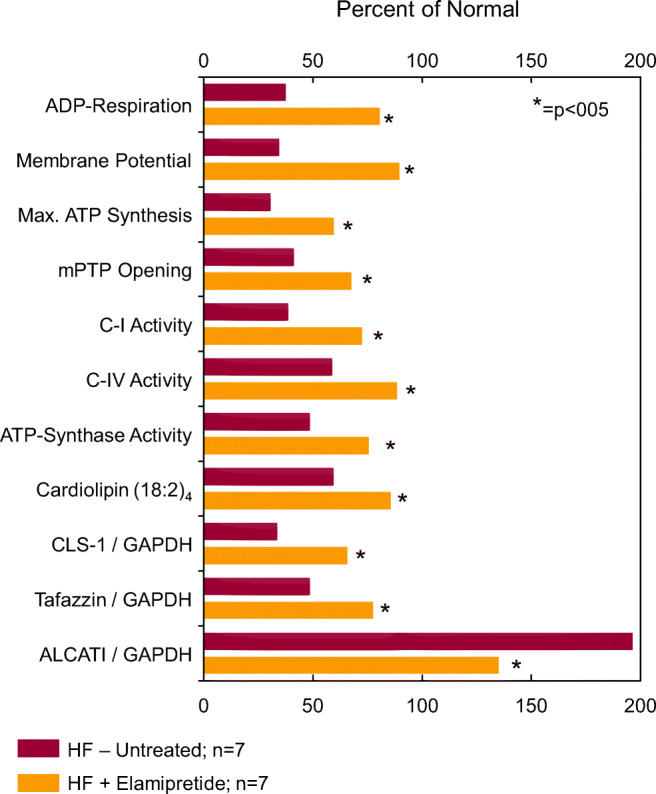
Fig. 2.

Bar graph depicting magnitude of change of various measures of mitochondrial function calculated as a percent of levels seen in normal dogs (Percent of Normal). The percentages are shown for untreated dogs with coronary microembolization-induced heart failure (HF-Untreated; n = 7) and for dogs with heart failure treated with elamipretide (HF+Elamipretide; n = 7). Original data in references 163 and 167. The measures are as follows: ADP-dependent state 3 respiration (ADP-Respiration); mitochondrial membrane potential; mitochondrial maximum rate of ATP synthesis (Max. ATP Synthesis); mitochondrial permeability transition pore opening (mPTP Opening); mitochondrial complex I (C-I) activity; mitochondrial complex IV (C-IV) activity; ATP synthase activity; cardiolipin (18:2)4; cardiolipin synthase-1 levels (CLS-1) normalized to glyceraldehyde 3-phosphate dehydrogenase (GAPDH) levels; tafazzin levels normalized to GAPDH; and acyl CoA lysocardiolipin acyltransferase-1 (ALCAT1) levels normalized to GAPDH
