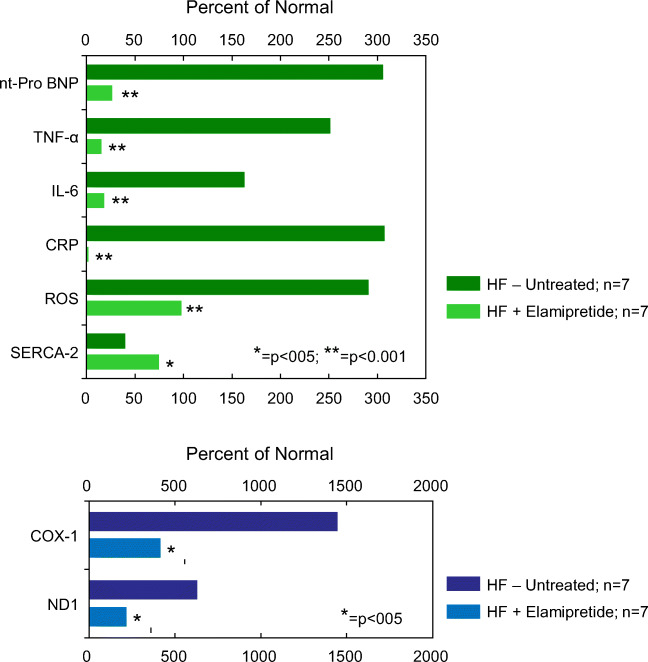
Fig. 3.
Top: Bar graph depicting magnitude of change of plasma cytokines, plasma natriuretic peptide, plasma reactive oxygen species (ROS), and left ventricular tissue levels of calcium ATPase (SERCA-2a) calculated as a percent of levels seen in normal dogs (Percent of Normal). The percentages are shown for untreated dogs with coronary microembolization-induced heart failure (HF-Untreated, n = 7) and for dogs with heart failure treated with elamipretide (HF+Elamipretide, n = 7). Original data in reference 151. nt-pro BNP, n-terminal pro-brain natriuretic peptide; TNF-α, tumor necrosis factor alpha; interlukin-6; CRP, c-reactive protein. Bottom: Bar graph depicting magnitude of change of two plasma mitochondrial fragments also referred to as damage-associated molecular patters (DAMPs) calculated as a percent of levels seen in normal dogs (Percent of Normal). CVOX1, subunit of cytochrome c oxidase (complex IV); ND1, subunit of complex I

