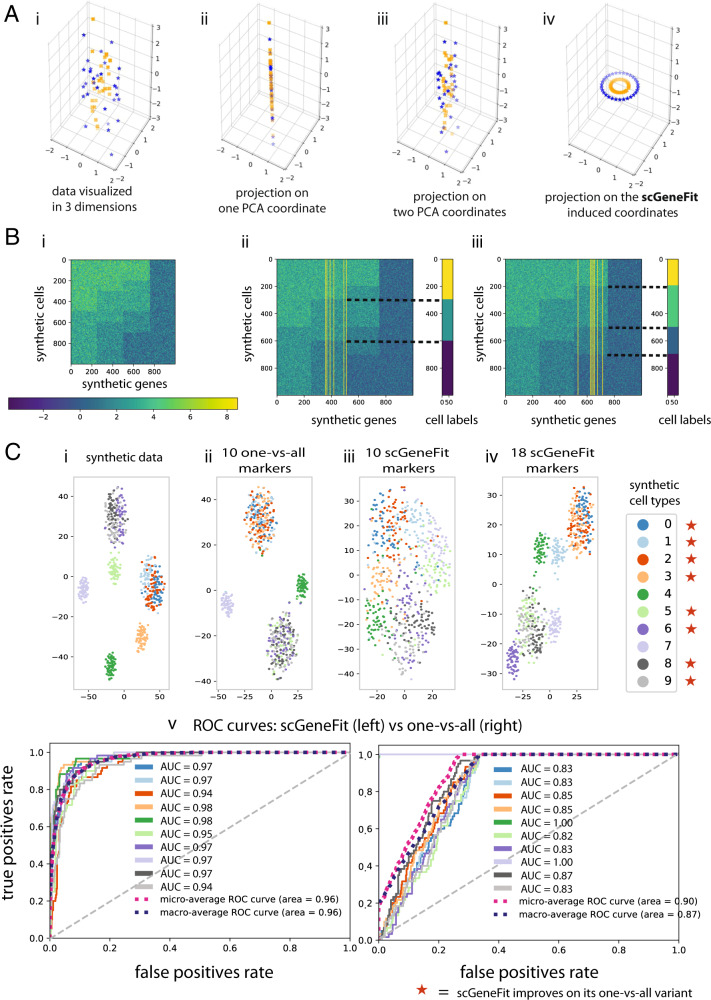
Fig. 1. scGeneFit identifies markers associated with a flat partition of cell type labels when applied to a wide range of synthetic datasets.
A Proof of concept inspired by ref. 13; cells are color coded with labels. In simulated high-dimensional data, for each sample, two dimensions (x- and y-axes) are drawn from concentric circles, and the remaining dimensions are drawn from white noise. The underlying structure is not apparent from the data (A-i). Considering each dimension in isolation, marker selection fails to capture the true structure (A-ii,iii). In contrast, scGeneFit recovers the correct dimensions as markers, and is able to recapitulate the label structure (A-iv). B Discriminative markers were correctly recovered by scGeneFit for simulated samples drawn from mixtures of Gaussians corresponding to two distinct label sets with three (B-ii), and four (B-iii) labels, respectively. Each row is a single sample and each column is a single feature or gene. Only 1000 genes of 10,000 are visualized, representing all the types simulated. The yellow lines correspond to the markers selected by scGeneFit. C t-SNE visualizations of results from the functional group synthetic data (C-i–iv). ROC curves comparing the performance of one-vs-all and scGeneFit in distinguishing cell labels following dimension reduction. scGeneFit outperforms one-vs-all in most cell labels when using the same number of markers (C-v).

