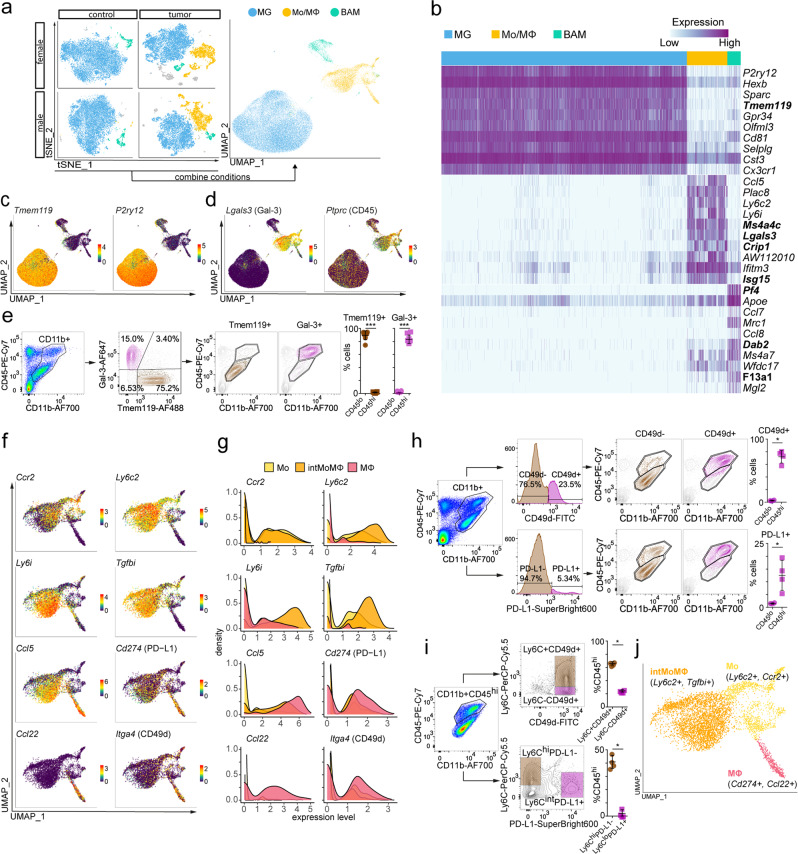
Fig. 2. Transcriptomic characterization of main myeloid subpopulations.
a Projection of cells combined from clusters identified as microglia (MG), monocytes/macrophages (Mo/MΦ), and BAMs from all groups. b Top ten differentially expressed genes for the three main identified cell populations, new marker candidates are in bold. c, d Feature plots depicting genes highly expressed in MG (c) and MoMΦ (d). e Flow cytometric analysis of the distribution of Tmem119 and Gal-3 protein markers within CD11b+ cells and projection of Tmem119+ and Gal-3+ cells onto CD45/CD11b graphs, dot plots demonstrate percentages of Tmem119+ and Gal-3+ cells within CD45hi and CD45lo groups (n = 8, 4 males, and 4 females, two-sided Mann–Whitney U test, mean ± SD, *** < 0.001, Tmem119 Pv = 0.0002, Gal-3 Pv = 0.0002). f Feature plots depicting distribution of the expression of genes discriminating monocytes (Mo), monocyte–macrophage intermediate (intMoMΦ), and macrophage (MΦ) subpopulations. g Density plots demonstrating the expression level of markers discriminating the Mo/MΦ subpopulations. h Flow cytometry analysis of CD49d and PD-L1 proteins within CD11b+ cells and their projection onto CD11b/CD45 graphs, dot plots demonstrate percentages of CD49d+ and PD-L1+ cells within CD45hi and CD45lo groups (n = 4, 2 males, and 2 females; two-sided Mann–Whitney U test, mean ± SD, * < 0.05, CD49d Pv = 0.0286, PD-L1 Pv = 0.0286). i Flow cytometry analysis of the distribution of the markers discriminating Mo/MΦ subpopulations within CD11b+CD45hi cells, dot plots demonstrate percentage of CD11b+CD45hi cells that belong to the defined populations (n = 4, 2 males, and 2 females; two-sided Mann–Whitney U test, mean ± SD, * < 0.05, Ly6C CD49d Pv = 0.0286, Ly6C PD-L1 Pv = 0.0286). j UMAP plot showing clusters of Mo/MΦ subpopulations.

