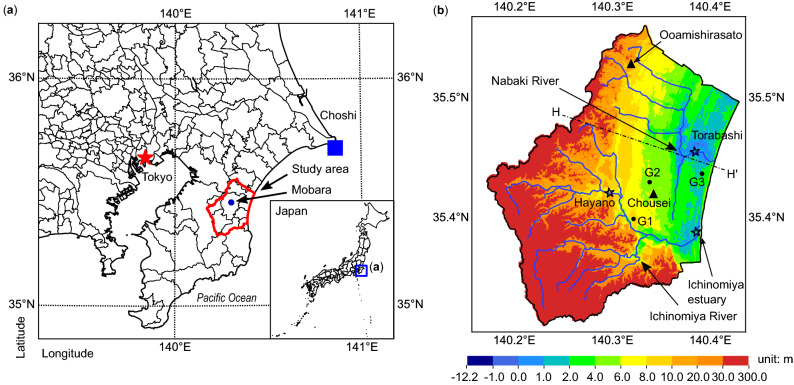
Figure 1.
Location and topographic map of the study area. (a) The location of research site. Choshi is a tidal station, and the measured sea levels at Choshi were used as the coastal boundary conditions in the model. (b) The topographic map in the year 2013. Two river systems: Nabaki River and Ichinomiya River, flow through the study area. The Chosei station showed around 0.11 m subsidence, and the Oamishirasato station around 0.13 m subsidence due to the 2011 Tohoku earthquake29. Torabashi, Hayano and Ichinomiya Estuary are the river gauging stations, and the measured river water levels were used to calibrate model parameters (Fig. S3). G1, G2 and G3 are groundwater observation wells, and the measured groundwater levels were also used to calibrate the model parameters (Fig. S4). The modeled geological cross-section along the line H–H’ is shown in Fig. S2(c). (Figure generated using Matplotlib v. 2.2.3, http://www.matplotlib.org. Local basemaps from Geospatial Information Authority of Japan, Global Map Japan v. 2.2, http://www.gsi.go.jp, accessed 29 Jul 2020).

