Figure 2.
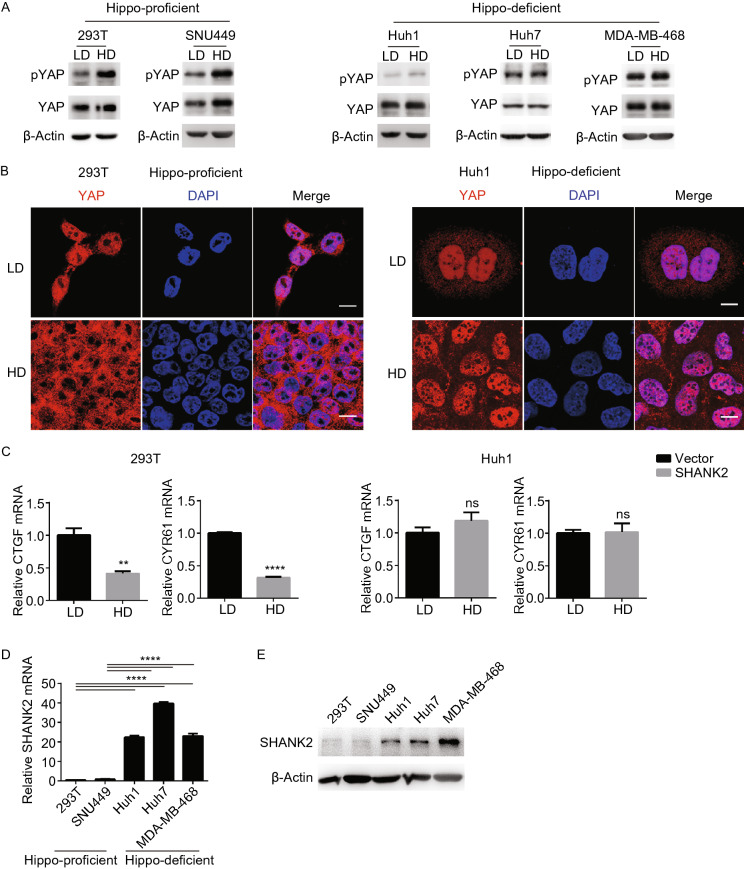
Hippo signaling and SHANK2 expression in human cell lines. (A and B) Analysis of human cell lines regarding their functional status of Hippo signaling. Hippo signaling was analyzed in human cell lines at low or high cell density (LD or HD) with indicated antibodies. Western blot analysis was used to analyze YAP phosphorylation status (A), and immunofluorescence was used to analyze subcellular localization of YAP. Scale bars: 10 μm (B). (C) Expression level of CTGF and CYR61 in 293T (Hippo-proficient) and Huh1 (Hippo-deficient) cell lines at low or high cell density (LD or HD). The expression level of CTGF and CYR61 was analyzed by qPCR. Data represent mean ± SEM from results of three independent experiments. P value was calculated by Student’s t test; **P < 0.01, ****P < 0.0001. (D and E) mRNA and protein level of SHANK2 in indicated human cell lines. For qPCR analysis in (D), data represent mean ± SEM from results of three independent experiments. P value was calculated by Student’s t test; ****P < 0.0001

