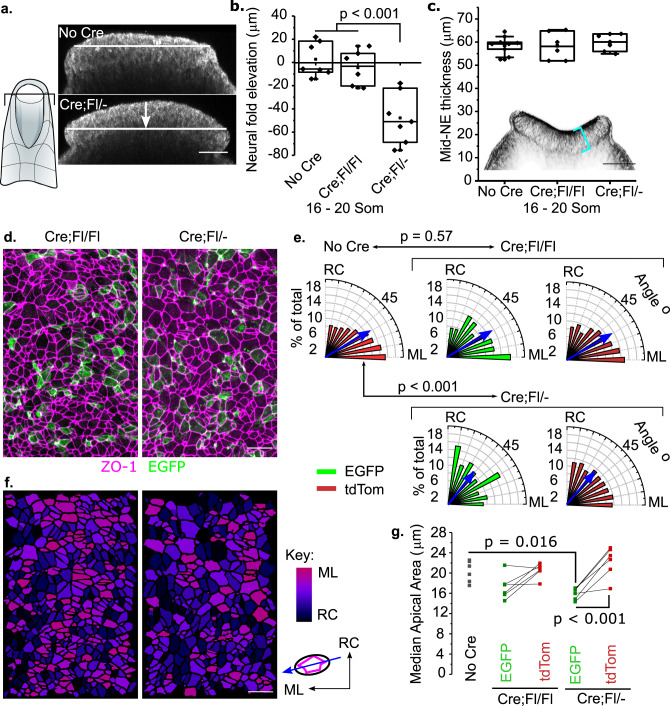
Fig. 2. Mosaic Vangl2 deletion disrupts planar polarised neuroepithelial apical orientation.
a Optical cross-sections through the caudal PNP (at 75% of rostrocaudal PNP length, shown in schematic) of No Cre and Cre;Fl/− embryos at E9.5, visualised using reflection imaging. The white arrow indicates the quantified eversion of the apical neuroepithelium, which should elevate its lateral margins to form neural folds. Scale = 50 µm. b, c Quantification of neural fold elevation (b, positive values) or eversion (b, negative values) and mid-PNP neuroepithelial thickness (c) in control, Cre;Fl/Fl and Cre;Fl/− embryos at 16–20 somite stages, before the PNP is significantly longer in Cre;Fl/− embryos. The inset shows an optical cross-section through a phalloidin-stained PNP indicating the thickness of the neuroepithelium (cyan bracket). b Control = 7, Cre;Fl/Fl = 6, Cre;Fl/− = 7 embryos. c Control = 9, Cre;Fl/Fl = 6, Cre;Fl/− = 7 embryos. Scale = 50 µm. d Representative (>6 embryos) surface-subtracted images of the apical neuroepithelium in a Cre;Fl/Fl embryo and Cre;Fl/− littermate showing the apical marker ZO1 and recombined cells lineage traced with EGFP. Scale = 20 µm. e Quantification of the orientation of the apical long axis of neuroepithelial cells in No Cre, Cre;Fl/Fl and Cre;Fl/− embryos. Blue arrows indicate the median orientation; p values from Chi2 with Yates continuity correction; EGFP and tdTom not significantly different within genotypes. No Cre 5592 cells from six embryos; Cre;Fl/Fl EGFP/tdTom 318/2373 cells from five embryos; Cre;Fl/− EGFP/tdTom 267/3799 cells from six embryos. RC rostrocaudal, ML mediolateral. f Apical surfaces from d colour coded to illustrate orientation. Bright colours indicate medio-lateral, dark colours indicate rostro-caudal orientation. Scale = 50 µm. g Quantification of neuroepithelial apical area. Each point represents the median value for an embryo and lines link points from the same embryo, n = 6 embryos per genotype. p values from ANOVA with post-hoc Bonferroni. Embryos compared had 15–20 somites and had been administered tamoxifen 24–28 h prior to analysis.

