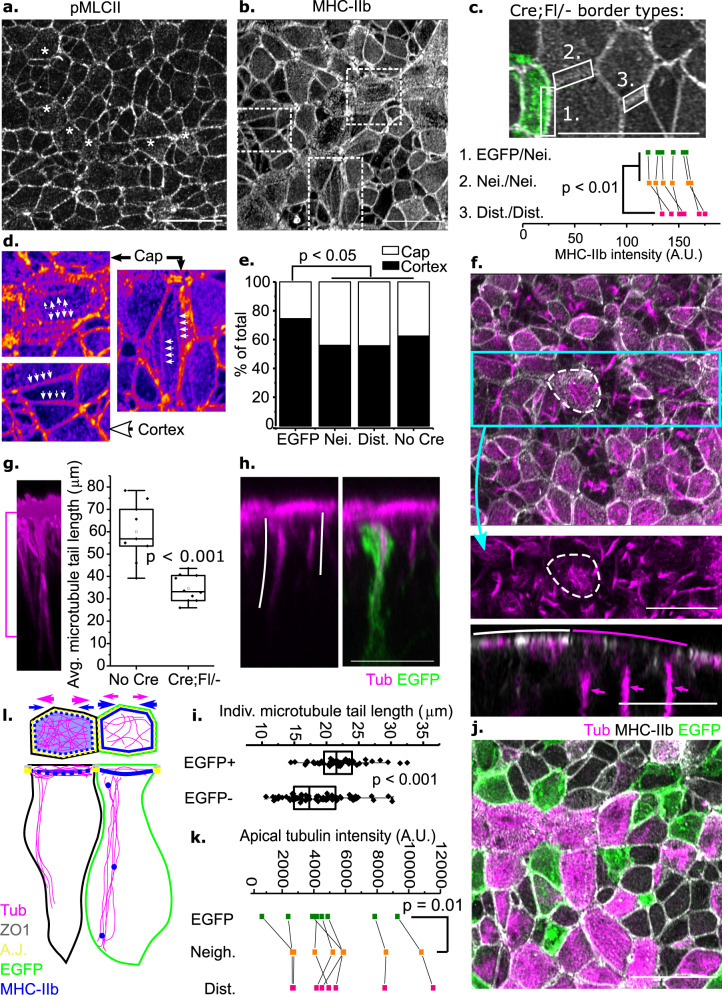
Fig. 5. Autonomous and non-autonomous cytoskeletal changes may underlie diminished apical constriction.
a, b Surface-subtracted neuroepithelial pMLCII (a) and total MHC-IIb (b) wholemount images. * apical staining. Dashed boxes indicate the cells shown in d. c Quantification of MHC-IIb intensity along 1: EGFP-Neighbour, 2: Neighbour–Neighbour, 3: Distant–Distant. Lines indicate values from the same embryo (n = 6 per genotype), compared by repeated measures ANOVA. d Representative cells showing apical cap arrangements (Cap) or primarily cortical (Cortex) MHC-IIb staining seen in >20 embryos. Fire LUT. Arrows indicate two types of MHC-IIb staining. e Quantification of the proportion of cells with primarily cortical or apical cap MHC-IIb. p values by X2. Cre;Fl/− EGFP = 98 cells, neighbour = 175, distant = 156 cells from six embryos; No Cre = 711 cells from six embryos. f Maximum-projection showing neuroepithelial MHC-IIb and β-tubulin (Tub) staining. Tubulin in the cyan boxed region is shown below. Cells with apical cap MHC-IIb have apical microtubules (cell outlined by dashed line). Bottom panel: optical cross-section showing apical cap myosin (white arc) overlies cells without long tubulin tails (magenta arrows/arc). g Quantification of average tubulin tail length in No Cre (n = 9) and Cre;Fl/− (n = 10) embryos. Points represent individual embryos. Magenta bracket indicates the length of tubulin tails. p value from Student’s T-test. h Maximum-projected optical cross-section showing tubulin tails in a Cre;Fl/− embryo. White lines indicate tail length. i Tubulin tail lengths in Vangl2-deleted (EGFP+) and Vangl2-replete (EGFP−) neuroepithelial cells. Points represent individual tails (EGFP = 64 tails, tdTom = 72 tails from four embryos from four independent litters). p value from Mann–Whitney U-test. j Representative (six embryos) surface-subtracted apical neuroepithelium of a Cre;Fl/− embryo showing apical tubulin, MHC-IIb and EGFP staining. k Tubulin staining intensity on the apical cap of surface-subtracted Vangl2-deleted (EGFP+), neighbouring and distant (EGFP−) cells. Lines indicate intensities from the same embryo (n = 8), compared by repeated measures ANOVA. l Schematic of cytoskeletal features in Vangl2-deleted (green) and neighbouring Vangl2-replete cells. Arrows = pro-constriction (blue) and opposing force (magenta). Images obtained using AiryScan; scale bars = 20 µm.

