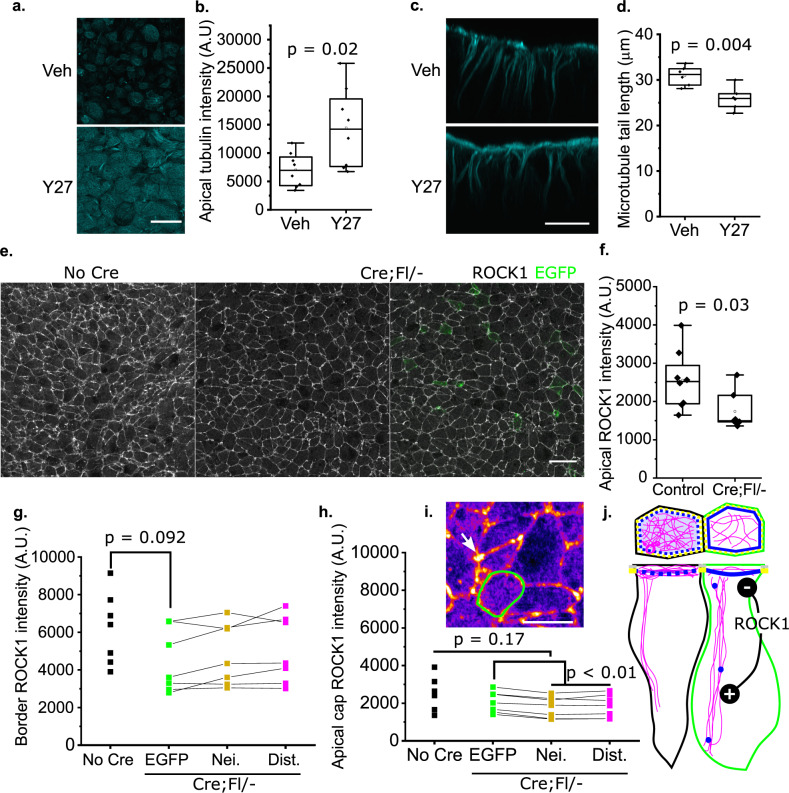
Fig. 6. ROCK activity enhances apical microtubules but shortens their apicobasal tails.
a–d Wild-type embryos were cultured in vehicle or 10 µm Y27632 (Y27). a Representative surface-subtracted images showing β-tubulin staining in vehicle and Y27-treated embryos (n = 8 each). b Quantification of microtubule apical staining in Y27-treated embryos compared with vehicle controls. c Optically-resliced cross-section showing microtubule apicobasal tails (from n = 6 embryos each). d Quantification of apicobasal tail length in vehicle and Y27-treated embryos. p values from Student’s T-test. e Representative surface-subtracted images showing ROCK1 staining in the apical neuroepithelium of control (n = 8) and Cre;Fl/− (n = 7) littermate embryos. The Cre;Fl/− embryo image is shown with (right) and without (left) the Vangl2-deleted EGFP cells. Scale bar = 20 µm. f Quantification of overall ROCK1 intensity in the apical neuroepithelium of control (n = 8) and Cre;Fl/− (n = 7) littermate embryos, demonstrating significantly lower signal in the latter. p value by Students T-test. g, h Quantification of ROCK1 staining intensity selectively, g along cell borders or h in the apical cap of neuroepithelial cells in control embryos lacking Cre or the indicated cell types in Cre;Fl/− embryos (n = 7 per genotype). These graphs are shown on the same scale to emphasise that ROCK1 border staining is much greater than apical cap staining, limiting visualisation of the latter. Points represent average values for cell types from individual embryos, lines link cell types from the same embryo. *p < 0.05 by mixed model analysis accounting for repeated measures from the same embryos. i High-power image of ROCK1 staining in the apical neuroepithelium shown in Fire LUT. Green border = Vangl2-deleted cell surrounded by Vangl2-replete neighbours. Arrow = ROCK1 localisation at junctions. Scale bar = 10 µm. j Schematic illustration of ROCK’s action. Refer to Fig. 5 for colour coding. ROCK activity favours apicobasal microtubule tails over their apical networks. ROCK localises more intensely in the apical cap of Vangl2-deleted cells (green), which have diminished apical microtubules but longer tails than their neighbours. All microscopy images were taken using AiryScan.

