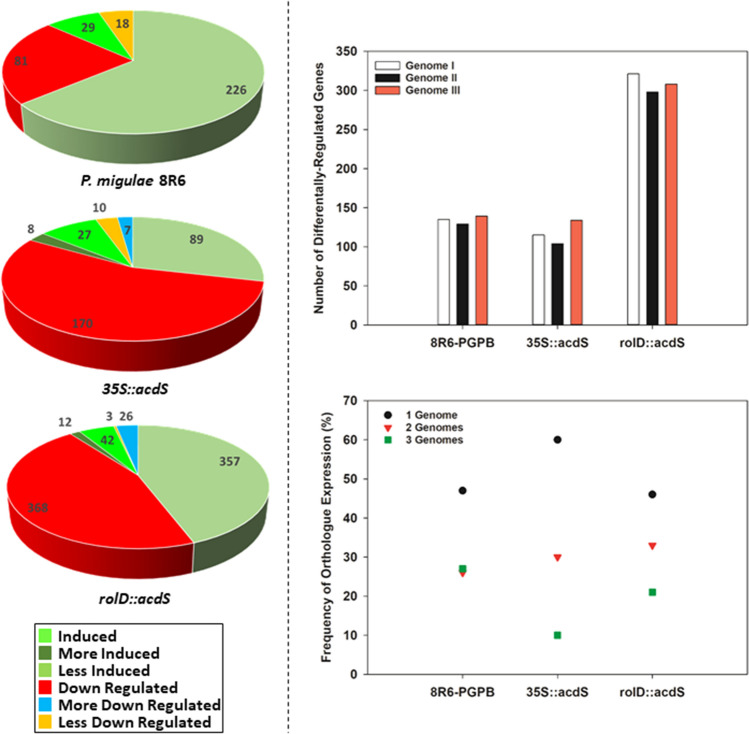
Figure 5.
Differential-expression genes in vegetative tissue from C. sativa lines expressing acdS under the control of the rolD promoter or the constitutive CaMV 35S promoter or from plants grown in soil treated with P. migulae 8R6 in the presence of salt (NaCl, 15 dS m−1). Left hand panel: Pie diagrams providing the number of genes that were differentially-regulated compared to the non-transgenic, untreated control. Right hand panel: plots representing the number of genes that were differentially-expressed on each of the C. sativa sub-genomes (top) and genome partitioning defined as the proportion of times when homeologous genes on one, two or three genomes were differentially-expressed (bottom). Genes with an FDR and p value ≤ 0.05 and with an absolute value of log 2 CPM higher than 1 were considered significant. Plots were drawn using SigmaPlot ver. 13.0 (Systat Software, Inc., San Jose, USA, www.systatsoftware.com).

