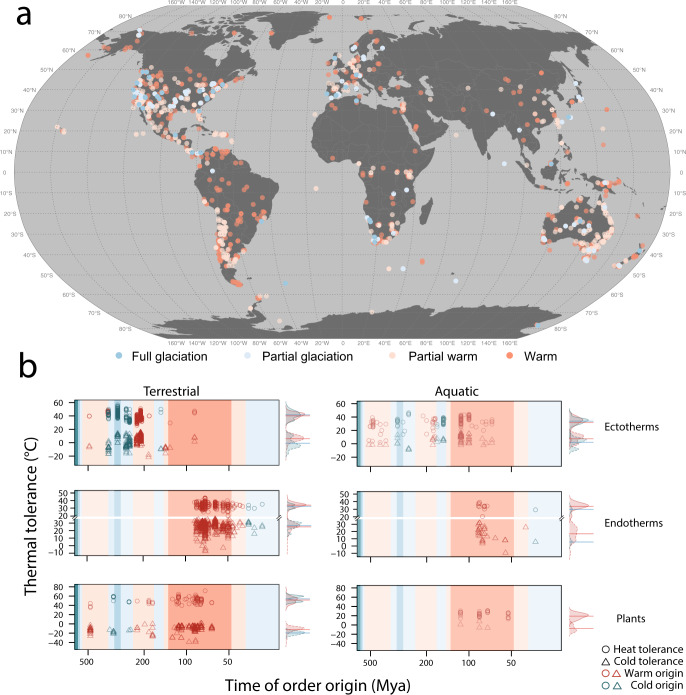
Fig. 1. A map illustrating the geographic location at which experimental specimens were collected and plots of the relationship between order age and thermal tolerance limits.
Map points (a) and the plot area shading (b) are coloured according to the prevailing paleoclimate at order origin (see Supplementary Fig. 2) full glaciation (blue), partial glaciation (light blue), partial warm (light orange) and warm (orange). b The raw relationships between order age in million years (mya) and lower (triangles) and upper (circles) thermal tolerance limits for ectotherms, endotherms and plants. Points (b) are coloured red for species in warm origin orders (partial warm and warm palaeoclimate categories as shown in the map) and blue for species in cold origin orders (full and partial glaciation palaeoclimate categories as shown in the map). For endotherms only (b), the axis is broken so that upper and lower thermal limits can be clearly delineated. Density distributions of upper and lower thermal tolerance limits are shown to the right of each panel b, aggregated by time of origin, following the same colour scheme as above, lines correspond to medians. Source data are provided as a Source Data file.

