
Fig. 2. Test of the effect of deep-time climate legacies.
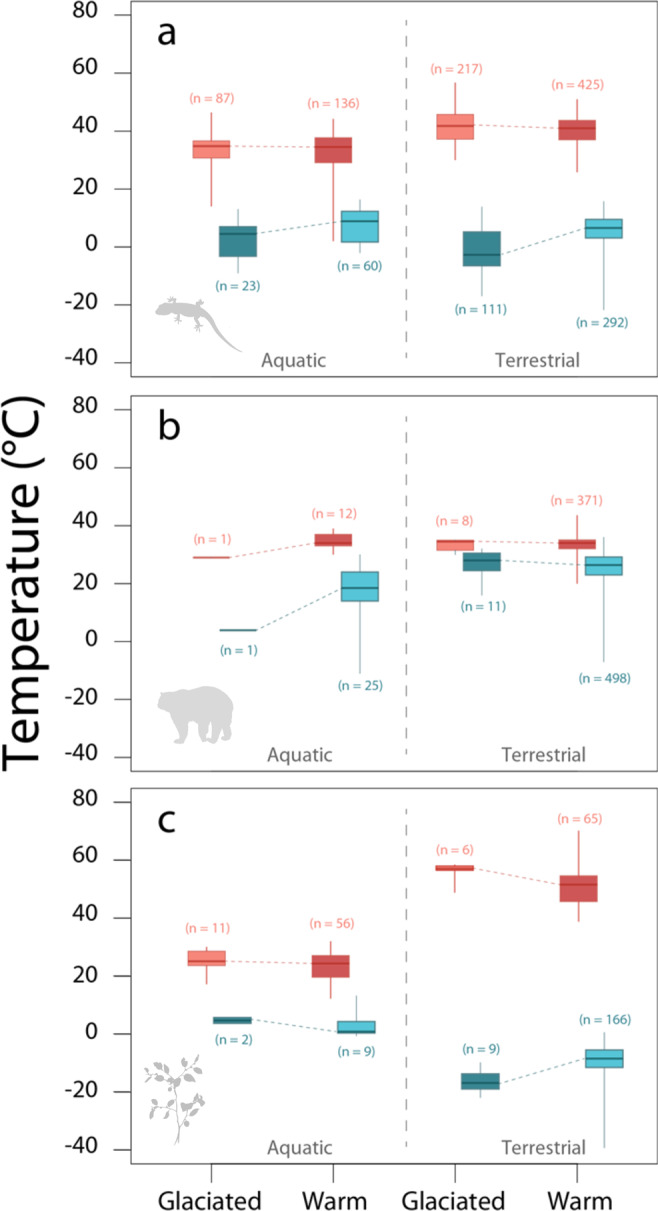
The boxplots compare the distributions of upper (red) and lower (blue) thermal tolerance of species belonging to orders of terrestrial and aquatic (a) ectotherms, (b) endotherms and (c) plants (photosynthetic plants and macroalgae). Dark colours reflect the palaeoclimatic conditions of order origination expected to show either lower values in lower thermal limits (darker blue for species belonging to orders originated under glaciated palaeoclimates—data from partial glaciated and glaciated paleoclimate categories combined) or higher values in upper thermal limits (darker red for species belonging to orders originated under warm non-glaciated palaeoclimates—warm and partial warm paleoclimate categories combined). For details on data collection see Supplementary Note 1. Boxes are bounded within the first and third quartiles, medians represented by thick horizontal lines within each box and, whiskers extending to the minimum and maximum values that do not exceed 1.5 times the interquartile range from the median (provided by default in R function ‘boxplot’). Source data are provided as a Source Data file.