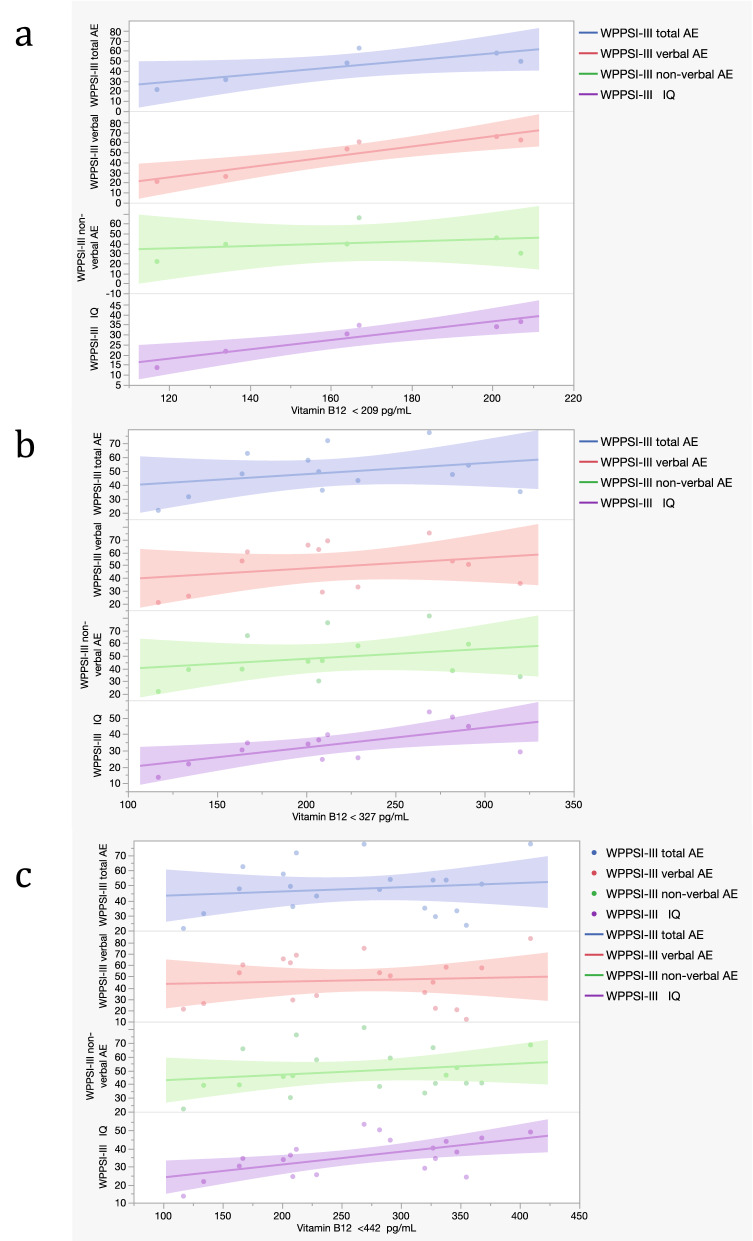
Figure 5.
Scatter plot representing correlations between vitamin B12 and cognitive scores in the WPPSI-III group. (a) Correlations between vitamin B12 < 209 pg/mL (L group of 25th percentile threshold; 6 subjects) and WPPSI-III subtests scores. (b) Correlations between vitamin B12 < 327 pg/mL (L group of 50th percentile threshold; 13 subjects) and WPPSI-III subtests scores. (c) Correlations between vitamin B12 < 442 pg/mL (L group of 75th percentile threshold; 20 subjects) and WPPSI-III subtests scores (see Supplementary Table S3). Each dot represents a sample subject. Each line represents a correlation analyzed.

