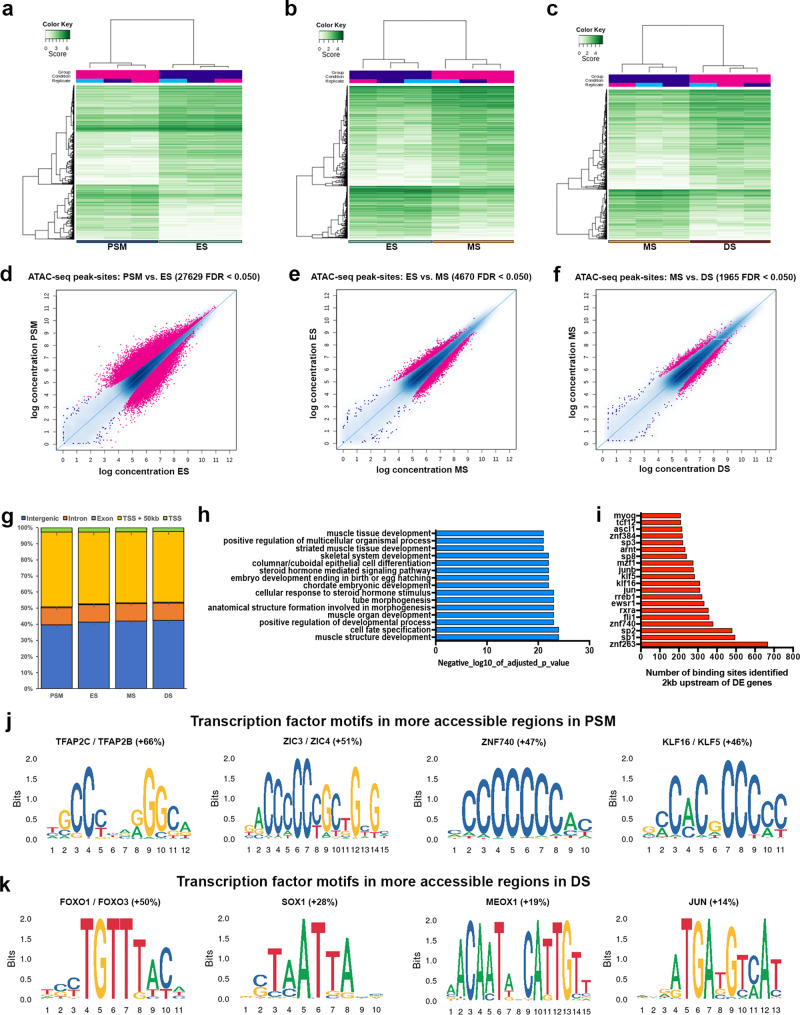
Fig. 2. Genome-wide profile of chromatin accessibility dynamics during somite development.
a Correlation heat maps of accessible chromatin regions (ATAC-seq peak sites) comparing PSM and ES, b ES and MS and c MS and DS. d MA plots of significantly differential peak sites (pink) comparing PSM with ES, e ES with MS and f MS with DS. g Bar plot showing proportions of total genome sequence of peaks in PSM, ES, MS and DS (error bars = SD). Nearly half of all peaks lie within 50 kb of the promoter and TSS and half are in intergenic and intron regions. h GO terms associated with enriched transcription factors in DS compared to PSM. For enriched GO terms, p values were obtained from a modified Fisher exact test. i Number of transcription factor binding sites identified within 2 kb upstream of differentially expressed genes in DS compared to PSM. j Motif enrichment analysis performed using Homer. Transcription factor motifs identified as enriched in PSM accessible regions and k in DS accessible regions. Percentage indicates increase of motifs identified in either PSM or DS for each motif.

