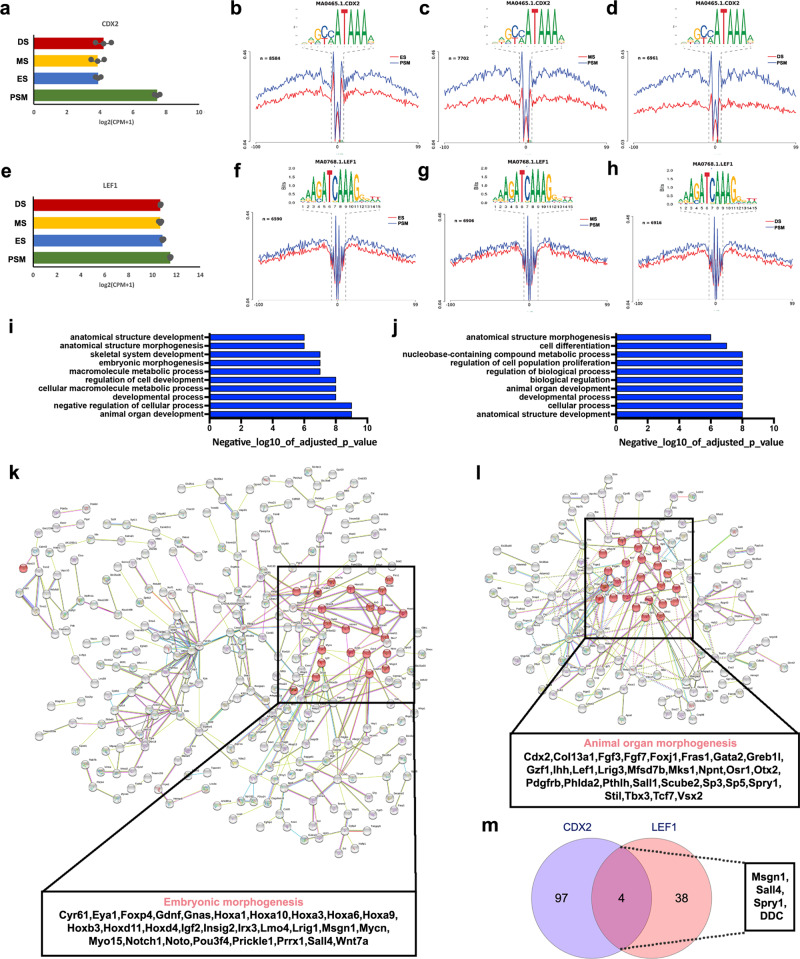
Fig. 3. Differential footprints identified for CDX2 and LEF1 during somite development.
a Gene expression from mRNA-seq (error bars = SEM, n = 3) for CDX2. b Tn5 insertion frequency across all accessible regions containing at least one CDX2 motif, at nucleotide resolution in PSM, ES, MS and DS reveals the presence of a footprint centred on the CDX2 motif. Differential footprinting for CDX2 motif comparing PSM and ES, c PSM and MS, and d PSM and DS. e Gene expression for LEF1 (error bars = SEM, n = 3). f Differential footprinting for LEF1 motif comparing PSM and ES, g PSM and MS, and h PSM and DS. Similar GO terms for genes associated with (i) CDX2 footprints and (j) LEF1 footprints. For enriched GO terms, p values were obtained from a modified Fisher exact test. k, l Protein–protein network analysis using STRING database. Interactions between genes identified with (k) CDX2 and (l) LEF1 footprints in an accessible region, within 10 kb upstream or downstream. Highlighted in red are genes correlated with embryonic morphogenesis in CDX2-associated genes and animal organ morphogenesis in LEF1-associated genes. m Venn diagram of CDX2-associated genes against LEF1-associated genes identified only four common genes—Msgn1, Sall4, Spry1 and DDC.

