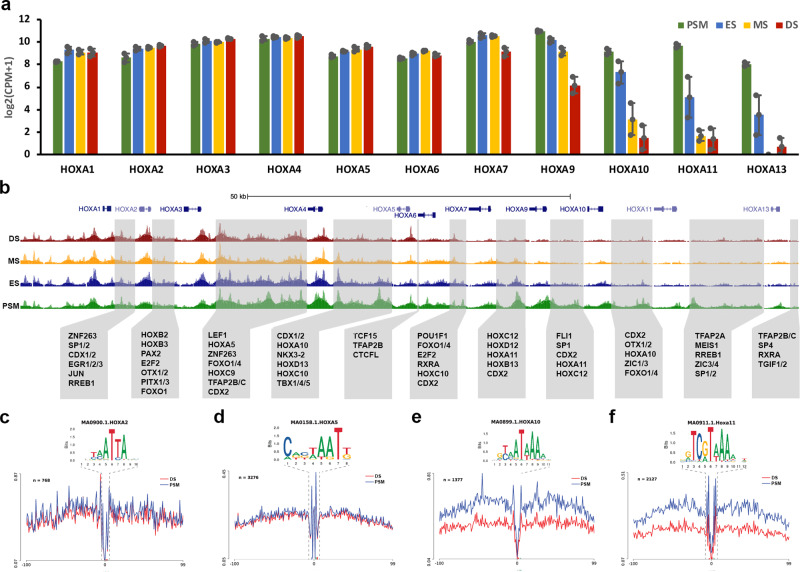
Fig. 4. Chromatin accessibility and differential footprints for HoxA cluster.
a Gene expression from mRNA-seq for HoxA cluster (error bars = SEM, n = 3) in paraxial mesoderm regions. b Genome browser views of ATAC-seq profile across the HoxA cluster. ATAC and RNA profiles are shown in green for PSM, in blue for ES, in yellow for MS and in red for DS. Grey boxes indicate intergenic accessible regions and transcription factor footprints identified within those regions. Genome-wide differential footprinting for (c) HoxA2, (d) HoxA5, (e) HoxA10 and (f) HoxA11 between PSM and DS.

