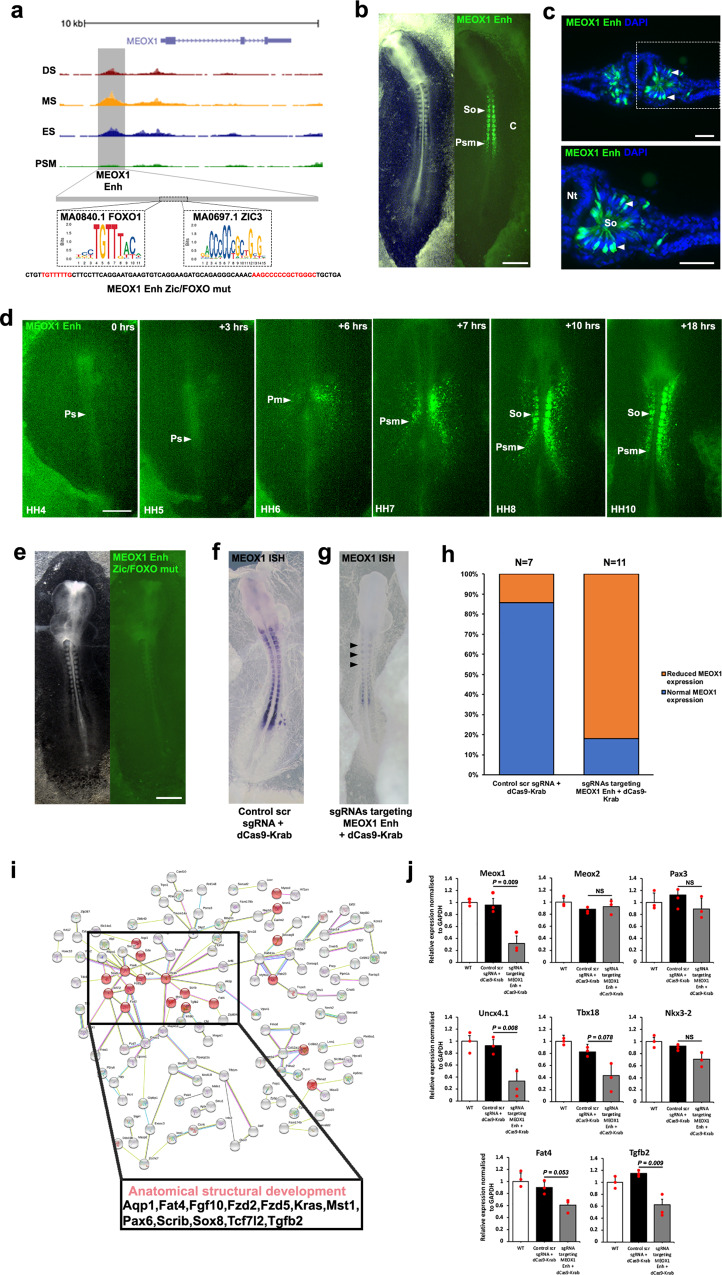
Fig. 6. Identification of a regulatory element for MEOX1.
a ATAC-seq profile at MEOX1 locus. Grey box indicates putative enhancer identified. FOXO1 and ZIC3 footprints identified within enhancer element. Mutant reporter sequence for MEOX1 Enh ZIC/FOXO mutant. b MEOX1 Enh reporter expression in presomitic mesoderm (Psm) and in somites (So) (n = 13/13). c Transverse sections of embryo in b immunostained for Citrine showing MEOX1 Enh expression in epithelial somites, white dashed line in b indicates location of section, representative of (n = 4/4). Nuclei stained with DAPI (blue). d Still photographs from a time-lapse movie of MEOX1 Enh with the primitive streak (Ps) indicated. Fluorescent activity first observed in prospective paraxial mesoderm (Pm) at HH6 and continuous expression in the presomitic mesoderm (Psm) at HH7 prior to expression in somites (So) at HH8 and HH10 (n = 3/3). e FOXO1 and ZIC3 binding site mutation in MEOX1 Enh Citrine reporter led to loss of expression (n = 6/7). Epigenome engineering using dCas9-Krab with (f) control scrambled sgRNAs resulted in no change (n = 6/7) and (g) sgRNAs targeting endogenous FOXO1 and ZIC3 binding sites led to loss of MEOX1 expression (n = 9/11) as shown by wholemount in situ hybridisation. h Percentage of embryos with normal (blue) or reduced (orange) MEOX1 expression after injection and electroporation of control scrambled sgRNA with dCas9-Krab or sgRNAs targeting MEOX1 Enh FOXO1 and ZIC3 binding sites with dCas9-Krab. i Protein–protein network analysis using STRING database. Interactions between genes identified with MEOX1 footprints in an accessible region, within 10 kb upstream or downstream. Highlighted in red are genes correlated with anatomical structural development based on GO analysis. j RT-qPCR on somites dissected from wild-type (WT) embryos, or embryos electroporated with control scrambled sgRNA and dCas9-Krab, or sgRNAs targeting MEOX1 Enh FOXO1 and ZIC3 binding sites with dCas9-Krab. Statistical significance was determined by a two-tailed Student’s t test. **p = 0.001–0.01; *p = 0.01–0.1; ns not significant. All scale bars = 500 μm except for c scale bar = 100 μm.

