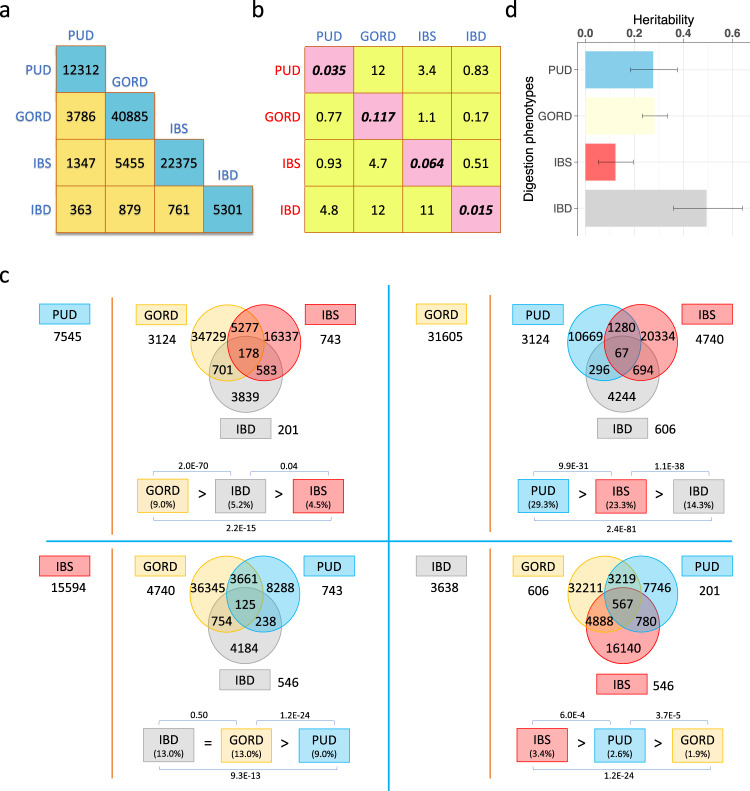
Fig. 1. Comorbidity analyses in unrelated European individuals and heritability estimation based on full-sibling relative risk for PUD, GORD, IBS, and IBD.
a The number of unrelated individuals with each diagnosis (cyan boxes) and the number of overlapped individuals between each pair of PUD, GORD, IBS, and IBD cases (yellow boxes). These differ from Table 1 because only unrelated individuals are considered here. b Cells represent ratio of the odds of disease cases from each column in those with disease from each row and the odds of each row disease cases in unrelated European-ancestry individuals. The diagonal elements are the sample risk rates and differ from “N case/(N case + N control)” in Table 1 because only unrelated individuals are included here. c Competitive comorbidity analyses for each of PUD, GORD, IBS, and IBD disease (defined, in turn, as index disease) to test among the other three diseases which disease is more prone to be comorbid with the index disease. The disease on the left of the red dashed line is the index disease and the number shows the number of cases without any comorbidity. The corresponding Venn diagram shows the number of individuals with recorded or self-report diagnosis with at least one of the other three diseases. The numbers outside of the Venn diagrams are the numbers of individuals with diagnosis of both the index disease and each of the other three diseases in turn, after removing the overlapped individuals for these three diseases. At the bottom of each Venn diagram is the proportion of the index disease cases in the other three diseases respectively, compared in pairs using a two-proportion Z test to test which disease is more prone to be comorbid with the index disease. d Heritability estimates and 95% confidence interval for PUD, GORD, IBS, and IBD based on full-sibling relative risk. See the Supplementary Note 1 for an example explaining b, c.

