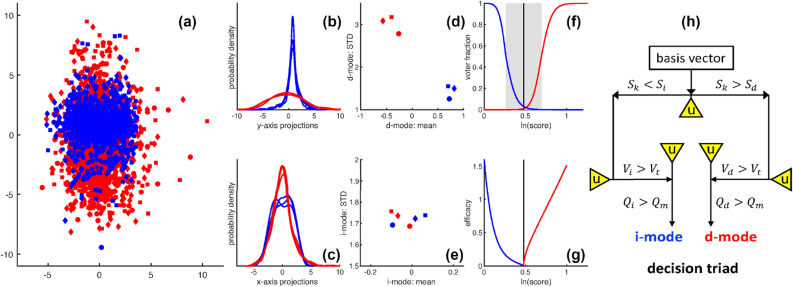
Figure 2.
Key aspects of SPLOC-RNN. (a) Example scattered data in a plane for six data streams. (b) Along the y-axis, data packets separate into two distinct classes. (c) Along the x-axis, all six data packets share similar emergent properties. These observations follow from the probability densities for scattered data projections. (d) A mode feature space plane (MFSP) plots the mean and standard deviation (STD) of the probability density along the y-axis for a discriminant-mode (d-mode). (e) The MFSP is shown for the probability density along the x-axis for an indifferent-mode (i-mode). (f) Voting activation functions for an i-mode (blue) and d-mode (red) are shown. The re-entrant behavior at the 50% levels bound the indecision region (gray area) due to uncertainty in discerning differences or similarities between systems. (g) The rectifying adaptive nonlinear unit is shown when d-mode (red) and i-mode (blue) functions have MFSP clustering quality factors set to unity. The bifurcation line is shown as a vertical black line in panels (f,g). (h) Flow chart for mode selection. The decision triad stratifies the complete set of basis vectors into discriminant, undetermined and indifferent modes. Discriminant and indifferent modes respectively quantify differences and similarities in features when signal-to-noise, statistical significance and quality of clustering all surpass minimum thresholds, otherwise the projection is an undetermined-mode, denoted by yellow triangles.

