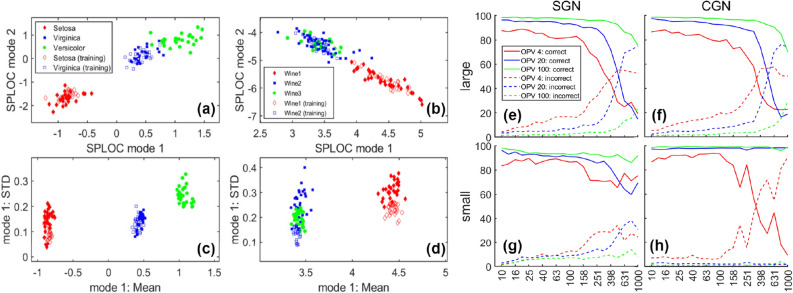
Figure 3.
Classification and feature extraction benchmarks. The top two d-modes project the raw data into two dimensions for the (a) Iris and (b) wine datasets. The mean and STD of data packets are shown within a mode feature space plane for the top d-mode that describes the (c) Iris and (d) wine datasets. In the right panel, four tabulated graphs show egg reconstruction percentages in the discriminant (correct) and indifferent (incorrect) subspaces as a function of system size for 4, 20 and 100 observations per variable (OPV). System size is characterized by the number of df. (e–h) Four tabulated plots are shown for a (large, small) egg placed in (SGN, CGN). Egg reconstruction percentages are shown for discriminant (correct) and indifferent (incorrect) subspaces as a function of df at an OPV of 4, 20 and 100.

